Grapevine Fertilization Guidelines
Funding provided by:
- Dormancy
- Bud Break
- Full Bloom
- Veraison
- Harvest
Nitrogen
(N) 
Grapevine Nitrogen Nutrition
Deficiency Symptoms
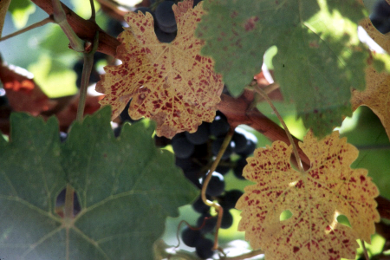
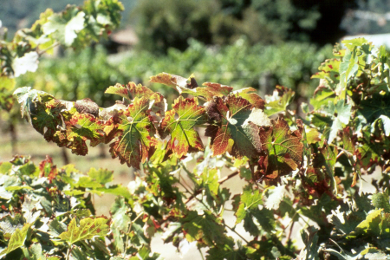
Vegetative growth of N deficient plants is reduced and leaves are small, thin, and stiff. Leaves turn pale green and later yellow. Young shoots, petioles and cluster stems turn pink or red [N4, N17].
Nitrogen deficiency slows the growth of shoots, results in shortened internodes, and causes the berries to mature early before they reach their normal size [N11, N18]. Nitrogen deficiency may first appear in spring [N4]. Leaf symptoms appearing after the beginning of ripening are caused by the translocation of N from the leaves to the berries [N17].
When N deficiency is accompanied by water stress, the leaf margins may roll slightly upwards, wilt and dry. Sometimes tissue between the veins turns light brown and dies. Under extreme N deficiency, the leaves wilt and drop [N11, N18].
Excessive Nitrogen
Excess N availability is characterized by dark green leaves, reduced fruit set, and delayed maturity [N11, N18]. High N availability results in high canopy vigor with excessively long shoots. The increased canopy density in turn reduces light interception in the fruit zone, which generally results in reduced concentrations of total soluble solids, anthocyanins, terpenes and total phenols in grapes [N5, N33]. However, the relationship between N status and berry composition is complex and depends on many other factors as well [N5].
High N uptake can also increase the susceptibility of grapevines to diseases, such as Bunch Stem Necrosis in which developing flower clusters are aborted by the vine, causing severe reductions in yield [N18, N33].
Nitrogen not taken up by the plants is likely
leached with winter rain and irrigation water,
contributing to nitrate contamination of
groundwater.
Phosphorus
(P2O5)
Grapevine Phosphorus Nutrition
Deficiency Symptoms
When P is deficient, shoot and root growth is
reduced. Leaves are small and dark green [P8]. Under
severe P deficiency, younger leaves may turn
reddish, whereas red spots near the edges may appear
on older leaves [P2, P8].
While veins remain green, the area between them
turns red, appearing as islands or bars of red
tissue [P7].
Phosphorus deficiency reduces fruit set, resulting
in loose and small clusters [P2].
 Phosphorus deficient grapevine leaves
(photo provided by the
International Plant Nutrition Institute).
Phosphorus deficient grapevine leaves
(photo provided by the
International Plant Nutrition Institute).
Affected Areas
On deep valley soils, P deficiency is generally of little concern and early University of California trials did not find measurable responses in yield or fruit quality to P fertilization [P4, P5].
However, in vineyards at higher elevations on marginal, shallow, and acidic soils, P availability may be limiting. Phosphorus deficient grapevines have been found in vineyards located on hillsides of the Coast Range or the Sierra Nevada foothills in northern California [P7, P18]. Especially soils of the Aiken Series have been found to fix P, resulting in P deficient grapevines [P7]. Other soil series with a low pH and P availability include Manzanita, Musick, Pentz, Redding and Sobrante [P11]. Soil series information for specific sites can be found with SoilWeb. For more information contact your local farm advisor.
Potassium
(K2O)
Grapevine Potassium Nutrition
Deficiency Symptoms
Early in the season, K deficiency results in light colored leaves with some necrotic spots along the edge of the leaf blades. Leaf margins dry and may either roll upwards or downwards. Leaf blades become distorted and ruffled. The symptoms are more pronounced under water stress [K11].
Late symptoms include yellowish to dark brown surface of older leaves at the base of the shoots exposed to sunlight [K2, K11]. The leaf margins turn upwards. The discoloration first appears between the veins, and spreads over the entire leaf area when K deficiency continues. Potassium can be translocated from the leaves to the ripening berries. For this reason, leaf symptoms are more severe on heavily cropped vines [K11].
Potassium deficiency may decrease frost resistance
and increases susceptibility to powdery mildew [K11].
 Potassium deficient grapevine leaves
(photo provided by the
International Plant Nutrition Institute).
Potassium deficient grapevine leaves
(photo provided by the
International Plant Nutrition Institute).
Affected Areas
Many soils located on the east side of the San Joaquin Valley, including the Lodi Wine Grape District, tend to fix K [K18]. These soils are formed from Sierra Nevadan alluvium and are weakly to moderately weathered [K22, K12]. A map showing the K fixation potential of soils located between Stockton and Sacramento can be found here. Soils with low K availability are also found in other regions. For more information contact your local farm advisor.
Within a vineyard, K deficiency can occur in small areas where the K-rich topsoil was removed during land leveling [K19].
Excessive Potassium
Berries are a strong sink for K, containing 60% or more of the K found in the entire aboveground biomass at harvest. Excess K levels in grape berries may impact wine quality by decreasing free tartaric acid, which in turn results in a higher pH of grape juice, must and wine [K16].
Furthermore, a field study on San Joaquin sandy loam revealed that excess K application rates may decrease water infiltration, especially when irrigation water with a low soluble salts content (low EC) is used [K19].
Soil Test
Soil Nitrate Test
Early work found that soil analyses are not a reliable means of determining grapevine nutrient availability. The inconsistent relationship between soil nutrient levels and grapevine needs has been attributed to the wide variety of soil types and depths involved, grape variety and rootstock differences, the effect of root pest and diseases, and the climatic differences among California's grape growing regions [N8, N11]. For this reason, no University of California guidelines for N, P or K soil test interpretation have been established.
Common Soil Analyses
Soil analyses are useful for determining the suitability of a site before planting and in establish vineyards to diagnose problems such as extreme pH, high salt concentrations, cation imbalances (Mg:Ca:K), and toxic levels of boron, chloride, or sodium [N23, N32]. Soil samples should be taken from the part of the soil profile that will be the major root zone. Smart and coworkers [N31] compiled rooting depth information from different studies. Their analysis revealed that approximately two thirds of grapevine roots are in the upper two feet of the profile. On average, however, more than 20% of the roots were found below 4 feet. In most cases, soil properties have a greater influence on depth distributions than the type of rootstock [N31]. Furrow irrigated vines may also have a deeper and more widespread root system than drip-irrigated vines [N2].
Petiole analysis
Petiole Analysis
Plant tissue analyses are a useful tool to assess the vine nutrient status and tune the fertilization program, especially when used in combination with other tools, such as observations of vine development and wine quality [N29].
Petiole Sampling
As nutrient content changes during the growing season, it is important to collect samples at the proper time. In California, petioles of leaves opposite the flower clusters, sampled at full bloom, are generally used to determine the nutritional status of grapevines in spring, allowing time for adjustments in the fertilization program to prevent nutrient imbalances later in summer and fall. Grapes are in full bloom, when approximately two-thirds of the caps have loosened or fallen from the flowers [N9].
To obtain a representative sample, 50 to 100 petioles should be collected, with one or two petioles per vine from vines uniformly distributed over the management area [N11, N19]. Separate petiole samples should be taken from different management units each of which representing a single variety and rootstock [N8, N11, N14].
Interpretation of Results
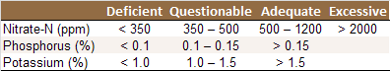
The optimal petiole nitrate-N concentration is
between 500 and 1200 ppm (Table 1). Concentrations
over 2000 to 2400 ppm can be associated with
excessive growth or reduced fruit set, while levels
over 3000 ppm can produce direct toxic effects, such
as leaf burn [N11, N14].
The optimal values have been established based on
research with ‘Thompson Seedless’ grapevines.
However, a study in ‘Chardonnay’ and ‘Cabernet
Sauvignon’ vineyards indicated that the values are
applicable for other cultivars and rootstocks as
well [N34].
Table 1: Interpretation of petiole nutrient
concentrations at full bloom [N11].
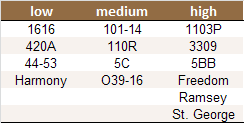
Effect of Variety and Rootstock
Petiole nitrate levels differ among varieties
(Table 2) and rootstocks (Table 3) and are
influenced by temperature, other nutrients and water
availability [N9, N14,
N19]. For example, under identical
conditions, the petiole nitrate concentration is
lower for ‘Barbera’ vines than for ‘Grenache’ vines.
Comparing the present petiole nutrient
concentrations with the results of the previous
years from the same management unit helps with the
interpretation of the results. For more information
contact your local farm advisor.
Table 2: Classification of wine grape varieties
based on their capacity to accumulate nitrate [N6, N8, N19].
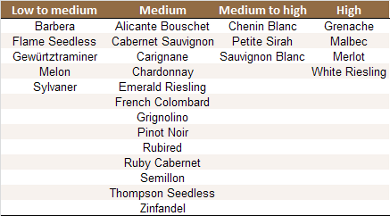
Table 3: Petiole nitrate-N concentrations at bloom
as affected by rootstock. The study was carried out
in ‘Chardonnay’ and ‘Zinfandel’ vineyards located in
Sacramento and Amador Counties [N20].
Soil Applied N
Soil Applied N
Application Rate
Grapevines have a low N fertilizer requirement compared to most other crops [N23]. On average about 2.9 lbs of N is removed from the vineyard in one ton (2000 lbs) of fresh grapes, with values ranging from 1.8 to 4.1 lbs [N21]. Nitrogen should be applied to ensure an adequate N supply during spring development, but available N in late summer should not be high enough to encourage late-season shoot growth, delay maturity, and promote immature canes [N24].
Recommended N application rates for raisin
production range from 0 to 60 lbs/acre depending on
irrigation system, soil type and vigor of the vines
(see Table). While the raisin yield averages 9-10
tons/acre, the yield of wine grapes is generally
lower, averaging 7 tons/acre in California, with
even lower tonnages in most coastal wine grape
vineyards. Therefore, the required application rates
for wine grapes may be substantially lower than the
values reported in the table. However, the values
reported in the table for drip irrigated systems
correspond to the N rate generally recommended for
wine grapes (M. Battany, personal communication). To
determine the correct application rate, it is
important the take petiole nitrate concentrations as
well as vine growth and wine quality into
consideration.
Suggested N application rates in raisin vineyards [N10].
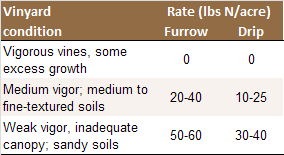
Nitrogen needs to be applied with caution to vines grafted onto the nematode-resistant rootstocks ‘Ramsey’, ‘Freedom,’ or ‘Harmony’ because they are prone to excess vigor [N10]. Contact your local farm advisor for more information.
When groundwater is used for irrigation, the nitrate in the water can contribute a significant part of the vineyard's N requirement. These application rates should be corrected for the amount of N contained in the irrigation water [N10].
Mode of Application
Drip Irrigated Systems
In drip-irrigated vineyards, fertigation is
generally the most effective way to apply N [N28].
Furrow Irrigated Systems
Under furrow irrigation, fertilizer should be placed near the outer edges of the furrow towards the vine row [N11]. Urea and ammonium forms should always be drilled at least 2 inches deep into the soil or immediately incorporated, since they are subject to volatilization losses if left on the surface [N10, N11]. For young vines and on sandy soils, fertilizer should be applied within 3 feet of the row to ensure root access [N11].
Fertilizer Type
Generally, the type of mineral N fertilizer can be chosen based on cost [N10]. Urea, ammonium and nitrate fertilizers all provide readily available N. In some situations, however, one type of fertilizer may be preferred.
Urea and ammonium fertilizers, especially ammonium sulfate, acidify soils over time and should be avoided on soils with a pH below 6 [N10].
Grapevines fertilized in the fall should have an active, healthy canopy for three to four weeks after application. When uptake time is limited, a nitrate fertilizer, which is mobile and immediately available, may be the best choice [N26]. When the canopy is no longer active, the N is not taken up and may be leached below the root zone during the winter.
Time of Application
N uptake is relatively slow between budbreak and bloom but high between bloom and veraison. During this period, about half of the annual N demand is taken up [N13, N27, N30].
Due to the ability of grapes to mobilize reserves from permanent structures, time of application has less effect on grapevine performance than it has in annual crops, provided the N is applied during a period of active uptake [N1, N3].
Studies in San Joaquin Valley vineyards showed that N is best applied in spring during a period starting after budbreak until fruit set or post-harvest [N12, N27]. Early applications before or at budbreak are susceptible to leaching from sprinkler frost protection, late rainfall or excessive spring irrigations and should be delayed until after the frost danger period [N24]. Nitrogen applied between harvest and leaf senescence refills storage reserves in permanent structures and supports leaf growth the following spring, in regions where the leaf canopy remains active for an extended period after harvest [N26]. Postharvest applications need to be made as long as the canopy is healthy and functional to ensure adequate uptake [N12]. Nitrogen applications in late fall after leaf fall are inefficient, because N may be leached below the rootzone by winter rains [N24].
Furrow Irrigated Systems
Under furrow irrigation, especially in sandy soils, high application rates are best split into two applications in late spring/early summer or one application in spring and the other post-harvest [N10].
Drip Irrigated Systems
Under drip irrigation, 2-5 lbs N/acre may be applied weekly in spring [N10]. However, when leaching during the growing season is minimized one single application may be as effective as multiple small applications, provided the soil is not very sandy in texture [N25].
Soil Appl. N
Soil Applied N
Application Rate
Grapevines have a low N fertilizer requirement compared to most other crops [N23]. On average about 2.9 lbs of N is removed from the vineyard in one ton (2000 lbs) of fresh grapes, with values ranging from 1.8 to 4.1 lbs [N21]. Nitrogen should be applied to ensure an adequate N supply during spring development, but available N in late summer should not be high enough to encourage late-season shoot growth, delay maturity, and promote immature canes [N24].
Recommended N application rates for raisin
production range from 0 to 60 lbs/acre depending on
irrigation system, soil type and vigor of the vines
(see Table). While the raisin yield averages 9-10
tons/acre, the yield of wine grapes is generally
lower, averaging 7 tons/acre in California, with
even lower tonnages in most coastal wine grape
vineyards. Therefore, the required application rates
for wine grapes may be substantially lower than the
values reported in the table. However, the values
reported in the table for drip irrigated systems
correspond to the N rate generally recommended for
wine grapes (M. Battany, personal communication). To
determine the correct application rate, it is
important the take petiole nitrate concentrations as
well as vine growth and wine quality into
consideration.
Suggested N application rates in raisin vineyards [N10].
The values reported in the table for drip irrigation correspond to the N rate generally recommended for wine grapes (M. Battany, personal communication).
Nitrogen needs to be applied with caution to vines grafted onto the nematode-resistant rootstocks ‘Ramsey’, ‘Freedom,’ or ‘Harmony’ because they are prone to excess vigor [N10]. Contact your local farm advisor for more information.
When groundwater is used for irrigation, the nitrate in the water can contribute a significant part of the vineyard's N requirement. These application rates should be corrected for the amount of N contained in the irrigation water [N10].
Mode of Application
Drip Irrigated Systems
In drip-irrigated vineyards, fertigation is
generally the most effective way to apply N [N28].
Furrow Irrigated Systems
Under furrow irrigation, fertilizer should be placed near the outer edges of the furrow towards the vine row [N11]. Urea and ammonium forms should always be drilled at least 2 inches deep into the soil or immediately incorporated, since they are subject to volatilization losses if left on the surface [N10, N11]. For young vines and on sandy soils, fertilizer should be applied within 3 feet of the row to ensure root access [N11].
Fertilizer Type
Generally, the type of mineral N fertilizer can be chosen based on cost [N10]. Urea, ammonium and nitrate fertilizers all provide readily available N. In some situations, however, one type of fertilizer may be preferred.
Urea and ammonium fertilizers, especially ammonium sulfate, acidify soils over time and should be avoided on soils with a pH below 6 [N10].
Grapevines fertilized in the fall should have an active, healthy canopy for three to four weeks after application. When uptake time is limited, a nitrate fertilizer, which is mobile and immediately available, may be the best choice [N26]. When the canopy is no longer active, the N is not taken up and may be leached below the root zone during the winter.
Time of Application
N uptake is relatively slow between budbreak and bloom but high between bloom and veraison. During this period, about half of the annual N demand is taken up [N13, N27, N30].
Due to the ability of grapes to mobilize reserves from permanent structures, time of application has less effect on grapevine performance than it has in annual crops, provided the N is applied during a period of active uptake [N1, N3].
Studies in San Joaquin Valley vineyards showed that N is best applied in spring during a period starting after budbreak until fruit set or post-harvest [N12, N27]. Early applications before or at budbreak are susceptible to leaching from sprinkler frost protection, late rainfall or excessive spring irrigations and should be delayed until after the frost danger period [N24]. Nitrogen applied between harvest and leaf senescence refills storage reserves in permanent structures and supports leaf growth the following spring, in regions where the leaf canopy remains active for an extended period after harvest [N26]. Postharvest applications need to be made as long as the canopy is healthy and functional to ensure adequate uptake [N12]. Nitrogen applications in late fall after leaf fall are inefficient, because N may be leached below the rootzone by winter rains [N24].
Furrow Irrigated Systems
Under furrow irrigation, especially in sandy soils, high application rates are best split into two applications in late spring/early summer or one application in spring and the other post-harvest [N10].
Drip Irrigated Systems
Under drip irrigation, 2-5 lbs N/acre may be applied weekly in spring [N10]. However, when leaching during the growing season is minimized one single application may be as effective as multiple small applications, provided the soil is not very sandy in texture [N25].
Foliar N
Foliar N
Little research has been done on foliar N applications to grapes [N7]. Early studies found that foliar N applications did not increase leaf N concentration [N22] or improve vigor and yield in vineyards with adequate soil N applications in spring [N16]. Foliar applications of different N and K fertilizers had no effect on the contraction of malic and tartaric acid in the berries at harvest [N15].
Foliar N cannot replace soil or irrigation water applied N because the quantity of N that can be taken up by the leaves is too small to cover the seasonal requirements. Foliar N applications may provide some benefit when plants are N deficient. In this case, urea (0.3–0.5%) may be applied 1–4 times during the growing season depending on the severity of N deficiency [N4] .
Soil Test
Soil Analysis
Early work found that soil analyses are not a reliable means of determining grapevine nutrient availability [P4]. For this reason, no University of California guidelines for N, P or K soil test interpretation have been established.
A few studies used soil tests to assess P availability in vineyards. Grant [P11] reported that grapevines grown in acidic soils with Bray 1 P concentrations below 8 ppm are likely deficient. In a study carried out at two sites in Napa and El Dorado County with Bray 1 P concentrations of 3 ppm or less in the top foot of the soil profile, P fertilization significantly increased yield [P18].
Soil fumigation can decrease P acquisition of grapevines due to harmful effects on mycorrhizae [P11] .
Common Soil Analyses
Soil analyses are useful for determining the suitability of a site before planting and in establish vineyards to diagnose problems such as extreme pH, high salt contractions, cation imbalances (Mg:Ca:K), and toxic levels of boron, chloride, or sodium [P15, P21]. Soil samples should be taken from the part of the soil profile that will be the major root zone. Smart and coworkers [P19] compiled rooting depth information from different studies. Their analysis revealed that approximately two thirds of grapevine roots are in the upper two feet of the profile. On average, however, more than 20% of the roots were found below 4 feet. In most cases, soil properties have a greater influence on depth distributions than the type of rootstock [P19]. Furrow irrigated vines may also have a deeper and more widespread root system than drip-irrigated vines [P1].
Petiole analysis
Petiole Analysis
Plant tissue analyses are a useful tool to assess the fertilization program, especially when used in combination with other tools, such as observations of vine development and wine quality [P16].
Petiole Sampling
As nutrient contents changes during the season, it is important to collect petiole samples at the proper time. In California, petioles of leaves opposite the flower clusters, sampled at full bloom, are generally used to determine the nutritional status of grapevines. Grapes are in full bloom, when approximately two-thirds of the caps have loosened or fallen from the flowers [P3].
To obtain a representative sample, 50 to 100 petioles should be collected, with one or two petioles per vine from vines uniformly distributed over the management area [P4, P13]. Separate petiole samples should be taken from different management units each of which representing a single variety and rootstock [P4, P5].
Interpretation of Results
Phosphorus concentrations below 0.1% are
considered deficient [P4,
P5] (Table 1). Rootstock type and
variety affect P accumulation and use efficiency [P9, P10]. For
example, petiole P concentrations of vines on 110R
rootstocks were 36-50% higher than those of vines on
Freedom, AxR#1 and St. George rootstocks when grown
under identical conditions [P9].
For this reason, the deficiency threshold of 0.1%
should be used loosely [P11].
Comparing the present petiole nutrient
concentrations with the results of the previous
years from the same management unit helps
interpreting the results. For more information
contact your local farm advisor.
Table 1: Interpretation of petiole nutrient
concentrations at full bloom [P4].
Soil Applied P
Soil Applied Phosphorus
Application Rate
Based on several studies, the average amount of P in one ton (2000 lbs) of harvested fruits is 0.56 lbs, with values ranging from 0.44 to 0.78 lbs [P14]. Therefore, with a yield of 10 tons/acre, about 5.6 lbs P (13 lbs P2O5) are removed, while a yield of 7 tons/acre removes 3.9 lbs P (9 lbs P2O5). Applying the amount of P removed at harvest ensures that soil P availability is maintained over the years in soils with limited native P availability.
Vines grown on P deficient soils, however, may require larger application rates. For example, yield of grapevines grown in soils with very low P availability (Bray 1 P of 3 ppm or less) and a history of low petiole P concentrations was increased by 0.1-0.4 lb P/vine, which corresponded to 45-180 lbs/acre [P18]. Higher application rates did not increase yield further at the same site. For more information contact your local farm advisor .
Mode of Application
When a new vineyard is established on P poor soil, P is best applied by shanking dry fertilizer adjacent to the vine row, or by injecting liquid fertilizer through the drip system [P11]. In acidic soils that fix P, fertilizer is best applied in a band [P11].
As P is immobile in the soil, it does not move downwards into the soil profile. For this reason, the fertilizer should be placed within the wetting zone of the irrigation system so that roots can grow to the fertilizer band [P4]. Access to fertilizer left on the soil surface may be reduced because repeated drying may restrict root growth near the soil surface [P12]. Surface applied P is also more at risk of being removed with runoff, which can result in contamination of surface water bodies.
Phosphorus should only be applied with the drip system when the magnesium and calcium concentrations in the irrigation water are very low to prevent precipitation of magnesium or calcium phosphates which may clog the emitters. Precipitation can also be prevented by acidifying the irrigation water [P11]. Only soluble P fertilizers can be used for fertigation. Fertilizer is normally applied during the middle third of an irrigation event, which allows pre-wetting the soil prior to the application and flushing the drip system after the application [P11].
Fertilizer Type
Common P fertilizers are monoammonium phosphate, and single or triple superphosphate [P11, P22]. The N in monoammonium phosphate may increase P uptake [P11]. Rock phosphate is also used as a P source, but has poor solubility and should only be used on acidic soils.
Time of Application
Phosphorus is immobile in soil and is not readily leached below the rooting zone. Therefore, P fertilizer can be applied during the dormant season. However, when ammonium phosphate is used, the ammonium may be nitrified to nitrate, which is easily leached. Ammonium phosphate should be applied close to the time the vines can take it up.
Repeated small applications of P every 2-3 years to vineyards grown on soils with low P availability may be necessary to maintain adequate vine P status [P18].
Foliar P
Foliar Phosphorus
The effect of foliar P applications has been found to be minimal. Foliar P sprays applied for three consecutive years had no effect on vine growth, yield or fruit quality of ‘Pinot noir’ vineyards with a history of low vine P status [P17]. In this study, foliar fertilizer was applied with 95 gal/acre at a rate of 0.58 lb P/acre in the form of either phosphite or phosphate. The formulations also contained 0.18 lb N/acre and 0.29 lb K/acre. Vines were sprayed three times each year: just after bloom, one month after bloom, and near veraison [P17]. These results confirm results from an early study carried out in ‘Thompson Seedless’ vineyards located in the Central Valley where no measurable benefits from foliar P applications were apparent [P6] and a study where only minimal effects of foliar P and K applications on the chemical constituents in grapes were found [P20].
Soil Test
Soil Analysis
Early work found that soil analyses are not a reliable means of determining grapevine nutrient availability [K6]. For this reason, no University of California guidelines for N, P or K soil test interpretation have been established.
Common Soil Analyses
Soil analyses are useful for determining the suitability of a site before planting and in establish vineyards to diagnose problems such as extreme pH, high salt contractions, cation imbalances (Mg:Ca:K), and toxic levels of boron, chloride, or sodium [K21, K27]. Soil samples should be taken from the part of the soil profile that will be the major root zone. Smart and coworkers [K26] compiled rooting depth information from different studies. Their analysis revealed that approximately two thirds of grapevine roots are in the upper two feet of the profile. On average, however, more than 20% of the roots were found below 4 feet. In most cases, soil properties have a greater influence on depth distributions than the type of rootstock [K26]. Furrow irrigated vines may also have a deeper and more widespread root system than drip-irrigated vines [K1].
Petiole analysis
Petiole Analysis
Plant tissue analyses are a useful tool to assess the fertilization program, especially when used in combination with other tools, such as observations of vine development and wine quality [K24].
Petiole Sampling
As nutrient contents changes during the growing season, it is important to collect petiole samples at the proper time. In California, petioles of leaves opposite the flower clusters, sampled at full bloom, are generally used to determine the nutritional status of grapevines. Grapes are in full bloom, when approximately two-thirds of the caps have loosened or fallen from the flowers [K5].
To obtain a representative sample, 50 to 100 petioles should be collected, with one or two petioles per vine from vines uniformly distributed over the management area [K6, K14]. Separate petiole samples should be taken from different management units each of which representing a single variety and rootstock [K6, K9].
Interpretation of Results
Petiole K concentrations of 1.5% or higher are
considered adequate (see Table).
Table 1: Interpretation of petiole nutrient
concentrations at full bloom [K6].
Vines with petiole K concentration in the questionable range should be resampled 6 to 8 weeks after bloom. Potassium levels below 0.5% in the petioles of the most recently matured leaves suggest K deficiency, while concentrations above 0.8% can be considered safe [K6].
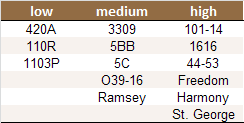
Effect of Variety and Rootstock
Rootstock type (see Table) and variety affect K
accumulation and use efficiency [K15]. Comparing
the present petiole nutrient concentrations with the
results of the previous years from the same
management unit helps interpreting the results. For
more information contact your local farm advisor.
Table 2: Petiole K concentrations at bloom as
affected by rootstock. The study was carried out in
‘Chardonnay’ and ‘Zinfandel’ vineyards located in
Sacramento and Amador Counties [K15].
Soil Applied K
Soil Applied Potassium
Application Rate
Based on several studies, the average amount of K in one ton (2000 lbs) of harvested fruits is 4.9 lbs, with values ranging from 3.2 to 7.4 lbs [K17]. Therefore, with a yield of 10 tons/acre, approximately 50 lbs K/acre (60 lbs K2O/acre) are removed from the field, while a yield of 7 tons/acre removes some 35 lbs K/acre (42 lbs K2O/acre). Applying the amount of K removed at harvest ensures that soil K availability is maintained over the years.
Vines grown on K fixing soils, however, may require much higher application rates. In a study with ‘Thompson Seedless’ grapes grown in a moderately to severely K deficient vineyard with a low K fixation potential under drip irrigation, the application of 0.22 and 0.44 lbs K/vine was effective over a two-year period, while applying 0.9 to 1.8 lbs K/vine (520 vines/acre) corrected K deficiency for at least 3 years [K7]. In a severely K deficient vineyard, deficiency symptoms during the first two years after K fertilization could only be reduced compared to the unfertilized control with a single application of 2.2 lb K/vine, but not with annual applications of 0.44 lb K/vine. The positive effect of the single heavy application did last four years [K3, K13]. For more information contact your local farm advisor.
Mode of Application
Furrow Irrigated Systems
Potassium is best applied to the bottom of a 6-8 inch deep furrow located at a distance of 18-24 inches from the vine on each side of the row [K6, K19]. However, in K deficient sandy soils, ‘Thompson Seedless’ grapes were found to respond more rapidly to surface applied K compared to K applied in a furrow. This may have been due to the fact that during the first year after surface application, most K is confined to the top foot of the profile where the root density is high [K3].
Drip Irrigated Systems
In drip irrigated systems, K can be fertigated. Because the nutrients at placed into moist soil with active roots, K use efficiency is generally increased when K fertilizer is fertigated as compared to a band application in a furrow close to the vine [K20].
Fertilizer Type
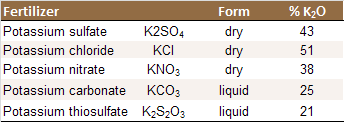
Different K fertilizers can be used in vineyards (Table), with potassium sulfate (K2SO4) being most popular [K20]. Differences between in-season applications of K in the form of K2SO4 and potassium chloride (KCl) to drip-irrigated ‘Thompson Seedless’ grapes at annual applications of up to 0.44 lbs K/vine were minimal [K7]. However, drainage problems or high soil chloride concentrations may prevent the use of KCl in some areas [K7]. In general, chloride fertilizers should be avoided in areas with salinity concerns. In another study carried out in a K deficient vineyard in Fresno County, K2SO4, KCl and potassium nitrate (KNO3) were equally effective in correcting foliar symptoms of K deficiency. The application of 2.2 lbs K/vine in the form of KCl in January increased foliar chloride concentrations, but no symptoms of excess chloride were detected [K13].
When potassium nitrate is used, the N needs to be
considered when determining application rates [K20]. Potassium
carbonate has an alkaline soil reaction and is often
used in acidic soils to increase soil pH. Potassium
thiosulfate, on the other hand, acidifies the soil
and is used in alkaline soils [K20].
Table: K fertilizers [K12,
K20].
Time of Application
Potassium demand is highest between bloom and
veraison. During this period roughly 60% of the
annual K demand is taken up [K8,
K23]. Between veraison and harvest,
only about 10% of the annual K demand is taken up.
This period is characterized by redistribution of K
from vegetative organs to the clusters. About 15% of
the annual K demand may be covered with postharvest
uptake [K8, K28].
Furrow Irrigated Systems
Dry material is most commonly applied during
dormancy either in fall or early spring [K6, K12].
Drip Irrigated Systems
In vineyards with drip irrigation, K can be fertigated during the growing season [K7], with applications being made before veraison [K20]. A single application of K in late April to drip-irrigated grapevines was equally effective as eight weekly split-applications between late April and mid-June in a ‘Thompson Seedless’ vineyard [K7]. However, it may be more practical to apply 10-15 lbs K2O/acre on a weekly basis than apply a large amount with one single application [K20].
Soil Applied K
Soil Applied Potassium
Application Rate
Based on several studies, the average amount of K in one ton (2000 lbs) of harvested fruits is 4.9 lbs, with values ranging from 3.2 to 7.4 lbs [K17]. Therefore, with a yield of 10 tons/acre, approximately 50 lbs K/acre (60 lbs K2O/acre) are removed from the field, while a yield of 7 tons/acre removes some 35 lbs K/acre (42 lbs K2O/acre). Applying the amount of P removed at harvest ensures that soil K availability is maintained over the years.
Vines grown on K fixing soils, however, may require much higher application rates. In a study with ‘Thompson Seedless’ grapes grown in a moderately to severely K deficient vineyard with a low K fixation potential under drip irrigation, the application of 0.22 and 0.44 lbs K/vine was effective over a two-year period, while applying 0.9 to 1.8 lbs K/vine (520 vines/acre) corrected K deficiency for at least 3 years [K7]. In a severely deficient vineyard, deficiency symptoms during the first two years after K fertilization could only be reduced compared to the unfertilized control with a single application of 2.2 lb K/vine, but not with annual applications of 0.44 lb K/vine. The positive effect of the single heavy application did last four years [K3, K13]. For more information contact your local farm advisor.
Mode of Application
Furrow Irrigated Systems
Potassium is best applied to the bottom of a 6-8 inch deep furrow located at a distance of 18-24 inches from the vine on each side of the row [K6, K19]. However, in K deficient sandy soils, ‘Thompson Seedless’ grapes were found to respond more rapidly to surface applied K compared to K applied in a furrow. This may have been due to the fact that during the first year after surface application, most K is confined to the top foot of the profile where the root density is high [K3].
Drip Irrigated Systems
In drip irrigated systems, K can be fertigated. Potassium use efficiency is generally increased when K fertilizer is fertigated as compared to a band application in a furrow close to the vine [K20].
Fertilizer Type
Different K fertilizers can be used in vineyards (Table), with potassium sulfate (K2SO4) being most popular [K20]. Differences between in-season applications of K in the form of K2SO4 and potassium chloride (KCl) to drip-irrigated ‘Thompson Seedless’ grapes at annual applications of up to 0.44 lbs K/vine were minimal [K7]. However, drainage problems or high soil chloride concentrations may prevent the use of KCl [K7]. In another study carried out in a K deficient vineyard in Fresno County, K2SO4, KCl and potassium nitrate (KNO3) were equally effective in correcting foliar symptoms of K deficiency. The application of 2.2 lbs K/vine in the form of KCl in January increased foliar chloride concentrations, but no symptoms of excess chloride were detected [K13].
When potassium nitrate is used, the N needs to be
considered when determining application rates [K20]. Potassium
carbonate has an alkaline soil reaction and is often
used in acidic soils. Potassium thiosulfate, on the
other hand, acidifies the soil and is used in
alkaline soils [K20].
Table: K fertilizers [K12,
K20].
Time of Application
Potassium demand is highest between bloom and
veraison. During this period roughly 60% of the
annual K demand is taken up [K8,
K23]. Between veraison and harvest,
only about 10% of the annual K demand is taken up.
This period is characterized by redistribution of K
from vegetative organs to the clusters [K8, K28]. About
15% of the annual K demand may be covered with
postharvest uptake.
Furrow Irrigated Systems
Dry material is most commonly applied during
dormancy either in fall or early spring [K6, K12].
Drip Irrigated Systems
In vineyards with drip irrigation, K can be fertigated during the growing season [K7], with applications being made before veraison [K20]. A single application of K in late April to drip-irrigated grapevines was equally effective as eight weekly split-applications between late April and mid-June [K7]. However, it may be more practical to apply 10-15 lbs K2O/acre on a weekly basis than apply a large amount with one single application [K20].
Foliar K
Foliar K
The quantity of K required by grapevines is too large to be supplied through the leaves [K4], and the benefits of foliar K applications have been found to be minimal. Three foliar applications to a K deficient vineyard between mid-May and early July of KNO3 (4-5 lbs/100 gallons) resulting in a total K application of approximately 0.075 lb/vine did not result in measurable K uptake or visual response [K13]. Other studies did not find effects of foliar K applications on vine growth, yield or fruit quality [K10, K25].
When plants are K deficient, KNO3 (0.4-1%) or other commercial K fertilizers may be applied 3–4 times every 15 days before and after flowering [K2] .
Acknowledgments
Guidelines and Webpage Design:
- Daniel Geisseler, Ph.D.; Post Doctoral Scientist; Department of Land, Air and Water Resources, University of California, Davis
Reviewers:
- Mark Battany; Farm Advisor; University of California Cooperative Extension San Luis Obispo & Santa Barbara Counties
- Clifford P. Ohmart, Ph.D.; Vice President of Professional Services; SureHarvest; Davis
- William R. Horwath, Ph.D.; Professor of Soil Biogeochemistry and James G. Boswell Endowed Chair in Soil Science; Department of Land, Air and Water Resources, University of California, Davis
Support:
- Asif Maan, Ph.D.; Branch Chief Feed,
Fertilizer, and Livestock Drugs Regulatory Services,
California Department of Food and Agriculture
- Amrith Gunasekara, Ph.D.; Science Advisor to the Secretary; California Department of Food and Agriculture
- Erika Lewis; Fertilizer Reserach and Education Program, California Department of Food and Agriculture
Last Update: January, 2014
Additional Information:
Links:
- UC ANR Integrated Viticulture
- Department of Viticulture and Enology UC Davis
- Department of Viticulture and Enology Fresno State University
- UC IPM online
- eViticulture
- San Joaquin Valley Winegrowers Association
- California Association of Winegrape Growers
- California Table Grape Commission
- Winegrape Growers of America
- American Society for Enology and Viticulture
References:
TOP OF PAGE
Nitrogen
- Araujo, F.J., Williams, L.E., 1998. Dry matter and nitrogen partitioning and root growth of young field-grown Thomposon Seedless grapevines. Vitis 27, 21-32.
- Araujo, F., Williams, L.E., Grimes, D.W., Matthews, M.A., 1995. A comparative study of young ‘Thompson Seedless’ grapevines under drip and furrow irrigation. I. Root and soil water distributions. Scientia Horticulturae 60, 235-249.
- Bates, T.R., Dunst, R.M., Joy, P., 2002. Seasonal dry matter, starch, and nutrient distribution in ’Concord’ grapevine roots. HortScience 37, 313-316.
- Bavaresco, L., Gatti, M., Fregoni, M., 2010. Nutritional deficiencies. In: Delrot, S., Medrano, H., Or, E., Bavaresco, L., Grando, S. (Eds.). Methodologies and Results in Grapevine Research. Springer Dordrecht, Heidelberg, London, New York. pp. 165-191.
- Bell, S.J., Henschke, P.A., 2005. Implications of nitrogen nutrition for grapes, fermentation and wine. Australian Journal of Grape and Wine Research 11, 242-295.
- Christensen, P., 1984. Nutrient level comparisons of leaf petioles and blades in twenty-six grape cultivars over three years (1979 through 1981). American Journal of Enology and Viticulture, 35, 124-133.
- Christensen, P., 1994. Foliar fertilization of grapevines. University of California Cooperative Extension Tulare County, Publication NG6-94.
- Christensen, P., 2000. Use of tissue analysis in viticulture. University of California Cooperative Extension Tulare County, Publication NG10-00.
- Christensen, P., 2002. Monitoring and interpreting vine mineral nutrition status for wine grapes. Proceedings of the Central Coast Wine Grape Seminar, Salinas.
- Christensen, L.P, Peacock, W., 2000. Mineral nutrition and fertilization. In: Raisin Production Manual. University of California Division of Agricultural and Natural Resources Publication 3393, Oakland, CA. pp. 102-114.
- Christensen, L.P., Kasimatis, A.N., Jensen, F.L., 1978. Grapevine nutrition and fertilization in the San Joaquin Valley. University of California Publication 4087.
- Christensen, L.P., Bianchi, M.L., Peacock, W.L., Hirschfelt, D.J., 1994. Effect of nitrogen fertilizer timing and rate on inorganic nitrogen status, fruit composition, and yield of grapevines. American Journal of Enology and Viticulture, 45, 377-387.
- Conradie, W.J., 2004. Partitioning of mineral nutrients and timing of fertilizer applications for optimum efficiency. In: Christensen, L.P., Smart, D.R. (Eds.). Proceedings of the Soil Environment and Vine Mineral Nutrition Symposium. American Society for Enology and Viticulture, Davis, CA. pp. 69-81.
- Cook, J.A., Wheeler, D.W., 1976. Use of tissue analysis in viticulture. In: Reisenauer, H.M. (Ed.). Soil and Plant-Tissue Testing in California. University of California, Division of Agricultural Sciences, Bulletin 1879. pp. 18-19.
- Failla, O., Scienza, A., Brancadoro, L., 1996. Effects of nutrient spray applications on malic and tartaric acid levels in grapevine berry. Journal of Plant Nutrition 19, 41-50.
- Fleming, H.K., Alderter, R.B., 1949. The effects of urea and oil-wax emulsion sprays on the performance of Concord grapevine under cultivation and in Ladino clover sod. Proceedings of the American Society for Horticultural Science 54, 171-176.
- Gärtel, W., 1993. Grapes. In: Bennett, W.F. (Ed.). Nutrient Deficiencies and Toxicities in Crop Plants. APS Press, St. Paul, MN. pp. 177-183.
- Hashim-Buckey, J.M., 2009. Management of mineral nutrition in table grape vineyards.
- Kliewer, W.M., 1991. Methods for determining the nitrogen status of vineyards. Proceedings of the International Symposium on Nitrogen in Grapes and Wine. The American Society for Enology and Viticulture. pp. 133-147.
- Lambert, J.J., Anderson, M.M., Wolpert, J.A., 2008. Vineyard nutrient needs vary with rootstocks and soils. California Agriculture 62, 202-207.
- Mullins, M.G., Bouquet, A., Williams, L.E., 1992. Biology of the grapevine. Cambridge University Press.
- Mack, G.L., Shaulis, N.J., 1947. Nutritional sprays on grapes. Phytopathology 37, 14-15.
- Peacock, W., Christensen, L.P., 2000. Interpretation of soil and water analysis. In: Christensen, L.P. (Ed.). Raisin Production Manual. University of California Division of Agricultural and Natural Resources, Publication 3393, Oakland, CA. pp. 115-120.
- Peacock, W.L., Broadbent, F.E., Christensen, L.P., 1982. Late-fall nitrogen application in vineyards is inefficient. California Agriculture 36, 22-23.
- Peacock, W.L., Christensen, L.P., Broadbent, F.E., 1986. Fertilization of grapevines with drip irrigation. Report of Research for Fresh Table Grapes. California Table Grape Commission, Fresno.
- Peacock, W.L., Christensen, L.P., Broadbent, F.E., 1989. Uptake, storage, and utilization of soil-applied nitrogen by Thompson Seedless as affected by time of application. American Journal of Enology and Viticulture 40, 16-20.
- Peacock, W.L., Christensen, L.P., Hirschfelt, D.J., 1991a. Influence of timing of nitrogen fertilizer application on grapevines in the San Joaquin Valley. American Journal of Enology and Viticulture 42, 322-326.
- Peacock, W.L., Christensen, L.P., Hirschfelt, D.J., Broadbent, F.E., Stevens, R.G., 1991b. Efficient uptake and utilization of nitrogen in drip- and furrow-irrigated vineyards. Proceedings of the International Symposium on Nitrogen in Grapes and Wine. The American Society for Enology and Viticulture. pp. 116-119.
- Robinson, J.B., 2004. Critical plant tissue values and application of nutritional standards for practical use in vineyards. In: Christensen, L.P., Smart, D.R. (Ed.). Proceedings of the Soil Environment and Vine Mineral Nutrition Symposium. American Society for Enology and Viticulture, Davis, CA. pp. 61-68.
- Pradubsuk, S., Davenport, J.R., 2010. Seasonal uptake and partitioning of macronutrients in mature ‘Concord’ grape. Journal of the American Society for Horticultural Science 135, 474-483.
- Smart, D.R., Schwass, E., Lakso, A., Morano, L., 2006. Grapevine rooting patterns: A comprehensive analysis and a review. American Journal of Enology and Viticulture 57, 89-104.
- Vasquez, S., Fidelibus, M., 2006. Considerations for monitoring grapevine nutritional status. California Fresh Fruit and Raisin News 22(5), 9-11.
- Wheeler, S.J., Pickering, G.J., 2003. Optimizing grape quality through soil management practices. Food, Agriculture & Environment 1, 190-197.
- Williams, L.E, 1999. Fertilizer use efficiency and influence of rootstocks on uptake and accumulation of nutrients in wine grapes grown in the coastal valleys of California. FREP Final Report.
TOP OF PAGE
Phosphorus
- Araujo, F., Williams, L.E., Grimes, D.W., Matthews, M.A., 1995. A comparative study of young ‘Thompson Seedless’ grapevines under drip and furrow irrigation. I. Root and soil water distributions. Scientia Horticulturae 60, 235-249.
- Bavaresco, L., Gatti, M., Fregoni, M., 2010. Nutritional deficiencies. In: Delrot, S., Medrano, H., Or, E., Bavaresco, L., Grando, S. (Eds.). Methodologies and Results in Grapevine Research. Springer Dordrecht, Heidelberg, London, New York. pp. 165-191.
- Christensen, P., 2002. Monitoring and interpreting vine mineral nutrition status for wine grapes. Proceedings of the Central Coast Wine Grape Seminar, Salinas.
- Christensen, L.P., Kasimatis, A.N., Jensen, F.L., 1978. Grapevine nutrition and fertilization in the San Joaquin Valley. University of California Publication 4087.
- Cook, J. A., Wheeler, D.W., 1976. Use of tissue analysis in viticulture. In: Reisenauer, H.M. (Ed.). Soil and Plant-Tissue Testing in California. University of California, Division of Agricultural Sciences, Bulletin 1879. pp. 18-19.
- Cook, J.A., Baranek, P.P., Christensen, L.P., Malstrom, H.L., 1968. Vineyard response to phosphate-zinc foliar sprays. American Journal of Enology and Viticulture 19, 17-26.
- Cook, J.A., Ward, W.R., Wicks, A.S., 1983. Phosphorus deficiency in California vineyards. California Agriculture 37, 16-18.
- Gärtel, W., 1993. Grapes. In: Bennett, W.F. (Ed.). Nutrient Deficiencies and Toxicities in Crop Plants. APS Press, St. Paul, MN. pp. 177-183.
- Grant, R.S., Matthews, M.A., 1996a. The influence of phosphorus availability, scion, and rootstock on grapevine shoot growth, leaf area, and petiole phosphorus concentration. American Journal of Enology and Viticulture 47, 217-224.
- Grant, R.S., Matthews, M.A., 1996b. The influence of phosphorus availability and rootstock on root system characteristics, phosphorus uptake, phosphorus partitioning, and growth efficiency. American Journal of Enology and Viticulture 47, 403-409.
- Grant, R.S., 1999. Managing phosphorus deficiency in vineyards. Practical Winery and Vineyard Journal January/February, 87-90.
- Keller, M., 2005. Deficit irrigation and vine mineral nutrition. American Journal of Enology and Viticulture 56, 267-283.
- Kliewer, W.M., 1991. Methods for determining the nitrogen status of vineyards. Proceedings of the International Symposium on Nitrogen in Grapes and Wine. The American Society for Enology and Viticulture. pp. 133-147.
- Mullins, M.G., Bouquet, A., Williams, L.E., 1992. Biology of the Grapevine. Cambridge University Press.
- Peacock, W., Christensen, L.P., 2000. Interpretation of soil and water analysis. In: Christensen, L.P. (Ed.). Raisin Production Manual. University of California Division of Agricultural and Natural Resources, Publication 3393, Oakland, CA. pp. 115-120.
- Robinson, J.B., 2004. Critical plant tissue values and application of nutritional standards for practical use in vineyards. In: Christensen, L.P., Smart, D.R. (Ed.). Proceedings of the Soil Environment and Vine Mineral Nutrition Symposium. American Society for Enology and Viticulture, Davis, CA. pp. 61-68.
- Schreiner, R.P., 2010. Foliar sprays containing phosphorus (P) have minimal impact on ‘Pinot Noir’ growth and P status, mycorrhizal colonization, and fruit quality. HortScience 45, 815-821.
- Skinner, P.W., Cook, J.A., Matthews, M.A., 1988. Response of grapevine cvs Chenin Blanc and Chardonnay to phosphorus fertilizer applications under phosphorus-limited conditions. Vitis 27, 95-109.
- Smart, D.R., Schwass, E., Lakso, A., Morano, L., 2006. Grapevine rooting patterns: A comprehensive analysis and a review. American Journal of Enology and Viticulture 57, 89-104.
- Topalovic, A., Slatnar, A., Stampar, F., Knezevic, M., Veberic, R., 2011. Influence of foliar fertilization with P and K on chemical constituents of grape cv. ‘Cardinal’. Journal of Agricultural and Food Chemistry 59, 10303–10310.
- Vasquez, S., Fidelibus, M., 2006. Considerations for monitoring grapevine nutritional status. California Fresh Fruit and Raisin News 22(5), 9-11.
- Verdegaal, P.S., 2009. Micro-nutrients major effects. Presentation held at the Calaveras Grape Growers Meeting.
TOP OF PAGE
Potassium
- Araujo, F., Williams, L.E., Grimes, D.W., Matthews, M.A., 1995. A comparative study of young ‘Thompson Seedless’ grapevines under drip and furrow irrigation. I. Root and soil water distributions. Scientia Horticulturae 60, 235-249.
- Bavaresco, L., Gatti, M., Fregoni, M., 2010. Nutritional deficiencies. In: Delrot, S., Medrano, H., Or, E., Bavaresco, L., Grando, S. (Eds.). Methodologies and Results in Grapevine Research. Springer Dordrecht, Heidelberg, London, New York. pp. 165-191.
- Christensen, P., 1975. Long-term responses of ‘Thompson Seedless’ vines to potassium fertilizer treatment. American Journal of Enology and Viticulture 26, 179-183.
- Christensen, P., 1994. Foliar fertilization of grapevines. University of California Cooperative Extension Tulare County, Publication NG6-94.
- Christensen, P., 2002. Monitoring and interpreting vine mineral nutrition status for wine grapes. Proceedings of the Central Coast Wine Grape Seminar, Salinas.
- Christensen, L.P., Kasimatis, A.N., Jensen, F.L., 1978. Grapevine nutrition and fertilization in the San Joaquin Valley. University of California Publication 4087.
- Christensen, L.P., Peacock, W.L., Bianchi, M.L., 1991. Potassium fertilization of Thompson Seedless grapevines using fertilizer sources under drip irrigation. American Journal of Enology and Viticulture 42, 227-232.
- Conradie, W.J., 2004. Partitioning of mineral nutrients and timing of fertilizer applications for optimum efficiency. In: Christensen, L.P., Smart, D.R. (Ed.). Proceedings of the Soil Environment and Vine Mineral Nutrition Symposium. American Society for Enology and Viticulture, Davis, CA. pp. 69-81.
- Cook, J. A., Wheeler, D.W., 1976. Use of tissue analysis in viticulture. In: Reisenauer, H.M. (Ed.). Soil and Plant-Tissue Testing in California. University of California, Division of Agricultural Sciences, Bulletin 1879. pp. 18-19.
- Failla, O., Scienza, A., Brancadoro, L., 1996. Effects of nutrient spray applications on malic and tartaric acid levels in grapevine berry. Journal of Plant Nutrition 19, 41-50.
- Gärtel, W., 1993. Grapes. In: Bennett, W.F. (Ed.). Nutrient Deficiencies and Toxicities in Crop Plants. APS Press, St. Paul, MN. pp. 177-183.
- Ingels, C., Verdegaal, P., Pettygrove, S., DeBiase, R., 2010. Potassium nutrition in vineyards. University of California Cooperative Extension Sacramento County Tree and Vine Newsletter, November, 2010.
- Kasimatis, A.N., Christensen L.P., 1976. Response of Thompson Seedless grapevines to potassium application from three fertilizer sources. American Journal of Enology and Viticulture 27, 145-149.
- Kliewer, W.M., 1991. Methods for determining the nitrogen status of vineyards. Proceedings of the International Symposium on Nitrogen in Grapes and Wine. The American Society for Enology and Viticulture. pp. 133-147.
- Lambert, J.J., Anderson, M.M., Wolpert, J.A., 2008. Vineyard nutrient needs vary with rootstocks and soils. California Agriculture 62, 202-207.
- Mpelasoka, B.S., Schachtman, D.P., Treeby, M.T., Thomas, M.R., 2003. A review of potassium nutrition in grapevines with special emphasis on berry accumulation. Australian Journal of Grape and Wine Research 9, 154-168.
- Mullins, M.G., Bouquet, A., Williams, L.E., 1992. Biology of the Grapevine. Cambridge University Press.
- O’Geen, A.T., Pettygrove, S., Southard, R.J., Minoshima, H., Verdegaal, P.S., 2008. Soil-landscape model helps predict potassium supply in vineyards. California Agriculture 62, 195-201.
- Peacock, B., 1999. Potassium in soils and grapevine nutrition. University of California Cooperative Extension Tulare County, Publication NG9-99.
- Peacock, W.L., 2004. Fertigating drip-irrigated vineyards with macro- and micronutrients. In: Christensen, L.P., Smart, D.R. (Ed.). Proceedings of the Soil Environment and Vine Mineral Nutrition Symposium. American Society for Enology and Viticulture, Davis, CA. pp. 129-133.
- Peacock, W., Christensen, L.P., 2000. Interpretation of soil and water analysis. In: Christensen, L.P. (Ed.). Raisin Production Manual. University of California Division of Agricultural and Natural Resources, Publication 3393, Oakland, CA. pp. 115-120.
- Pettygrove, G.S., Southard, R.J., 2003. Can we predict K fixation in the San Joaquin Valley from soil texture and mineralogy? FREP Final Report.
- Pradubsuk, S., Davenport, J.R., 2010. Seasonal uptake and partitioning of macronutrients in mature ‘Concord’ grape. Journal of the American Society for Horticultural Science 135, 474-483.
- Robinson, J.B., 2004. Critical plant tissue values and application of nutritional standards for practical use in vineyards. In: Christensen, L.P., Smart, D.R. (Ed.). Proceedings of the Soil Environment and Vine Mineral Nutrition Symposium. American Society for Enology and Viticulture, Davis, CA. pp. 61-68.
- Schreiner, R.P., 2010. Foliar sprays containing phosphorus (P) have minimal impact on ‘Pinot Noir’ growth and P status, mycorrhizal colonization, and fruit quality. HortScience 45, 815-821.
- Smart, D.R., Schwass, E., Lakso, A., Morano, L., 2006. Grapevine rooting patterns: A comprehensive analysis and a review. American Journal of Enology and Viticulture 57, 89-104.
- Vasquez, S., Fidelibus, M., 2006. Considerations for monitoring grapevine nutritional status. California Fresh Fruit and Raisin News 22(5), 9-11.
- Williams, L.E., Biscay, P.J., 1991. Partitioning of dry weight, nitrogen, and potassium in Cabernet Sauvignon grapevines from anthesis until harvest. American Journal of Enology and Viticulture 42, 113-117.
TOP OF PAGE