Pistachio Fertilization Guidelines
Funding provided by:

- Young Trees
- Dormancy
Winter - Bloom
Spring - Fruit Development
Summer - Harvest
Fall
Nitrogen
(N) 
Pistachio Nitrogen Nutrition
Deficiency Symptoms
Growth of N deficient trees is reduced. Shoots are thinner, shorter and the bark of young shoots may be reddish.
Initially, leaves are pale green, later they turn yellow and drop from the tree early. Leaves are generally smaller but normal in shape. The petioles and midribs of N deficient leaves become red. As N is mobile in plants, older leaves show deficiency symptoms first.
Nut yield is decreased when N is deficient [N10, N11]. Over- or under-irrigation or Verticillium wilt disease can produce similar symptoms [N4]. Deficiency symptoms are therefore best confirmed with leaf analyses.
Phosphorus
(P2O5)
Pistachio Phosphorus Nutrition
Deficiency Symptoms
Growth of P deficient pistachio trees is restricted resulting in shorter shoots and internodes, as well as smaller leaves. A reddish color may appear on the bark in the lower part of shoots and on petioles. Leaves turn dull green at first and later yellowish green (chlorosis) with small light-brown necrotic spots of irregular shape, which appear close the margins of the lower leaves on the shoots. The spots give the leaflets a bronzy appearance. Chlorosis may appear first on leaves terminal to nut clusters. Under more severe P deficiency, leaves dry and shed rapidly [P1, P12].
Potassium
(K2O)
Pistachio Potassium Nutrition
Deficiency Symptoms
Growth of K deficient plant is slow and leaves are smaller. Initially, leaves are pale, resembling N deficiency. Under more severe K deficiency, leaves turn yellow, starting at the tip and progressing down the curled leaf margins. The yellow leaf tissue eventually turns brown and dies, resembling sodium and/or chlorine toxicity. The symptoms are most pronounced on older leaves of current shoots. Edges and tips of the leaflets may also curl downward [K5, K10, K11]. K deficient trees are more susceptible to Verticillium wilt [K1].
Potassium deficiency has been found in limited areas in California including the Chico area, southwestern Santa Clara Valley, some sandy soils of the San Joaquin Valley, and some soils in Santa Barbara County [K5].
Adequate K availability can increase nut weight, percentages of split nuts and reduce percentages of blank and stained nuts, thus improving nut quality [K21].
Excessive Potassium
High K application rates may result in magnesium (Mg) deficiency and yield depression, especially in soils with marginal Mg availability. This can be prevented by monitoring and, when necessary, enhancing leaf Mg concentrations [K7].
Soil Test
Soil Analysis
Soil nitrate analyses are far less common in orchards than in annual crops. However, soil sampling to determine nitrate-N levels in the root zone provides support for nutrient management decisions [N1].
Nitrate-N present after leaf-out contributes to the tree’s N nutrition. One ppm of NO3-N in one foot of soil corresponds roughly to 3.5-4 lbs N/acre. For example, a NO3-N concentration of 5 ppm in the top foot of the profile corresponds to 17.5-20 lbs N/acre [N18]. In contrast, nitrate in the soil profile in fall is prone to leaching during the winter, especially in sandy soils with a low water holding capacity. High concentrations may be the result of N fertilizer applications in excess of tree demand [N18].
For more information on sampling procedure see Sampling for Soil Nitrate Determination.
Leaf Analysis
Spring Leaf Analysis
Recent research has resulted in the Pistachio Prediction Model, which uses nutrient analysis of spring leaf samples collected in May, 30-45 days after full bloom, to predict late summer nutrient concentrations of N and K. Sampling done early in the season provides information for in-season fertilizer adjustments.
Sampling Procedure
The following leaf sampling protocol is recommended [N6, N20]:
- If variable, divide your orchards into uniform blocks and take separate samples for each block.
- Collect leaves from non-fruiting, exposed branches.
- Collect 10 leaves per tree at 6-7 feet height, from around the tree canopy.
- Sample at least 18 trees, at a distance of 25 yards from an orchard block.
- Collected leaves may be pooled in one bag for analysis.
- Leaf samples should be collected between 30-45 days after full bloom.
- The sample needs to be analyzed for N, P, K, Ca, Cu, and Mg.
The concentrations of all analyzed nutrients and the time of sampling (days after bloom) can be entered into the Pistachio Prediction Model, which can be found here.
Interpretation of Results
The predicted July/August N and K concentrations can be interpreted as described for samples taken in July.
Leaf Analysis
Summer Leaf Analysis
Sampling Procedure
The following sampling procedure is recommended to determine the nutrient status of an orchard [N4]:
- If variable, divide your orchards into uniform blocks and take separate samples for each block.
- Take samples from late July through August.
- Randomly collect fully expanded sub-terminal leaflets from non-fruiting branches at about six feet from the ground.
- Sample 10-20 trees in each orchard block.
- Collect 4-10 leaves per tree.
- Do not sample leaves that have received in-season foliar nutrient applications for the elements of interest. This is especially important for micronutrients.
- Keep samples in labeled paper bags and submit them to the analytical lab within 24 hours of collection.
Interpretation of Results
Leaf nutrient concentrations change during the
season and may differ between leaves on the same tree depending on their location. The values in the table are based on leaves
sampled from late July through August following the sampling procedure outlined above. When good
trees are compared with poor ones, samples can be
taken anytime.
Critical and optimal nutrient concentrations in
pistachio leaves sampled from late July through
August [N4, N5, N24].
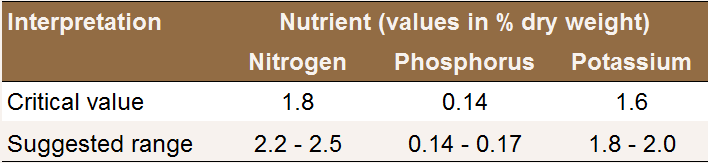
When leaf nutrient concentrations at or below the critical values, yield is 95% or less than the maximum and deficiency symptoms may be present. When the nutrient concentration is in the suggested range, tree growth and yield should be optimal provided other growth parameters are not limiting [N4].
N
N Fertilization of Young Trees
Nitrogen fertilizer requirements of young pistachio
trees depend on soil fertility. Application rates (see
Table) are best adjusted based on leaf analyses. Beede and
Kallsen [N3] recommend
an optimal leaf N concentration of 2-6-2.9% for rapidly
growing immature trees. This range is higher than the
range considered optimal for mature trees (see Leaf
Analysis).
Recommended N application rates for young pistachio trees
[N3].
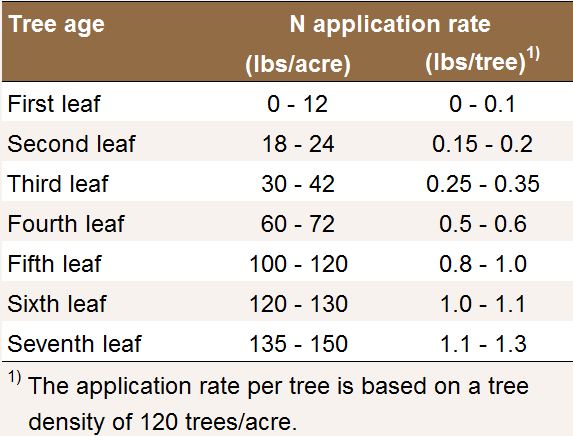
Fertilizer to young trees is best applied in mid-spring and early summer. Late applications after August can ecourage excessive vegetative growth and delay dormancy, which in turn increases the risk of frost damage [N3].
Little is known about the effects of different fertilizer types on young pistachio trees. For almonds, Brent Holtz [N12] recommends using granular fertilizers for first-leaf trees, because the risk of root burn is increased with liquid fertilizers, as their application may result in high concentrations in the root zone. To second-leaf trees, liquid fertilizers, such as UN-32 or CAN-17 can be applied. For almonds, it is recommended to place granular fertilizers at least 18 inches from the trunk, but within the wetting zone of the irrigation system [N12].
Soil Applied N /
Soil Applied N
Nitrogen Management Approach
Siddiqui and Brown [N21] proposed the following stepwise approach:
- If variable, divide your orchards into uniform blocks. Nitrogen management should be planned for each orchard block separately.
- Establish a preseason N fertilization plan based on expected yield.
- Take into account N contributions from irrigation water and organic fertilizers, such as manure or composts). For example, 27.3 lbs N/acre are applied with one acre foot of water with a nitrate-N concentration of 10 ppm.
- Apply early-season N based on your pre-season plan.
- Take leaf samples in May and conduct in-season yield estimation.
- Adjust the rate of the remaining N applications based on your leaf analyses and yield estimates.
All decisions of fertilization are influenced by local environment and must be adjusted accordingly. N fertilization calculations for different scenarios can be found here [N21].
Application Rate
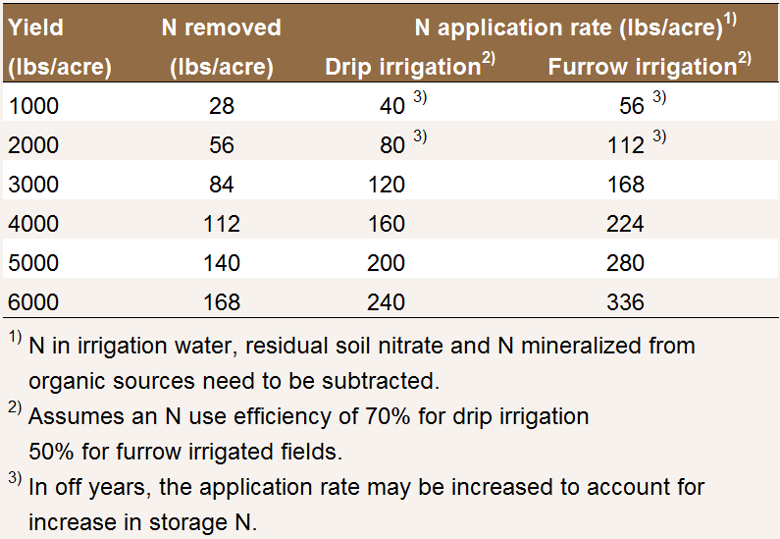
In observational field trials established in four orchards with 9-15 year old 'Kerman' pistachio trees located in the southern San Joaquin Valley, Brown and Siddiqui [N5, N6] found that on average 28 lbs of N are removed from the orchard per 1000 lbs of marketable yield (CPC). This value includes all nutrients removed in hulls, shells and kernels, blank nuts and other non-marketable yield per 1000 lbs [N5, N6].
Trials in almond orchards have shown that carefully managed fertigation of N can result in efficiencies of at least 70%. This is a feasible goal for pistachio given the high prevalence of micro irrigated and fertigated orchards [N5].
As an example, in an orchard with a marketable yield of 4000 lbs/acre, 112 lbs N/acre are removed from the orchard. Assuming 70% efficiency and no input from other sources such as irrigation water or organic fertilizers, about 160 lbs/acre of fertilizer N are needed (see Table). A model can be found here.
In addition, N is needed to support tree growth
requirements. On average, N uptake exceeded removal
with fruits and abscised leaves by 78 g N per tree
and year [N17].
In an orchard with 120 trees per acre, this
corresponds to about 21 lbs N/acre. However, most N
accumulates in perennial tissues during 'off' years,
while the N stored in perennial tissues decreases
during 'on' years. The N stored during ‘off’ seasons
is remobilized the following 'on' season mainly
between early leaf out and early hull split [N7, N17, N21, N22].
Approximate N application rates based on yield and N
use efficiency of the irrigation system (based on [N5, N6].
'On' Trees: Time of Application
In the period from dormancy (January) through early leaf-out, pistachio trees depend almost entirely on N that is remobilized from perennial organs, and essentially no N is taken up from the soil [N21]. Nitrogen applications before March are therefore subject to leaching past the root zone [N2]. In 'on' years, approximately 30% of N is taken up during spring flush (mid-March to late May) and 70% during nut fill. N uptake was found to be negligible between harvest and leaf senescence [N17].
At least 80% of nutrients should be applied during the active tree growth period commencing in early spring (after leaf-out begins) and continuing through early hull split. Based on field trials, Siddiqui and Brown [N21] recommend applying 20% of the annual demand after leaf-out, 30% during fruit growth, 30% during kernel fill and 20% during fruit maturity or early post-harvest as long as leaves are still healthy.
A minimum of two fertilization events and, ideally, four or more should be initiated between leaf-out and hull split. Frequent fertigation with smaller amounts of N ensures adequate soil N concentrations for plant uptake while reducing the periods of high N concentration that may be subject to leaching loss in subsequent irrigation or rainfall events [N21].
'Off' Trees: Time of Application
Nitrogen demand and uptake during spring flush are larger in 'off' trees compared to 'on' trees. This suggests that 'off' trees need more N early in the season [N16, N17]. Half the season’s N may be applied to 'off' trees prior to shell hardening and the remainder in July and August. [N2]. Late applications should be avoided. Nitrogen applications in September to 'off' trees can ecourage excessive vegetative growth and delay dormancy, which in turn increases the risk of frost damage [N3].
Mode of Application
Little research has been done to investigate the effects of fertilizer placement on pistachio trees. However, experience with other fruit and nut crops also apply to pistachios.
In microsprinkler irrigated orchards, fertigation is the most effective way to apply N fertilizer. The fertilizer should be injected into the irrigation system in the middle third of the irrigation set. For example, in a 18-hour irrigation set, fertilizer is injected from hour 6 through hour 12. This prevents urea and nitrate from moving below the root zone but still ensures that the N is distributed well in the wetting zone and does not remain in the irrigation system [N14].
Surface-applied dry or liquid urea and ammonium fertilizer must be incorporated as soon as possible to prevent ammonia volatilization losses [N8, N14]. Fertilizers are best applied in the herbicide strip along the tree rows and not broadcast over the entire area. Fertilizer applied between the rows is less efficiently used due to competition with weeds or cover crops and lower root density compared to the tree row [N15].
Fertilizer Type
A number of mineral N fertilizers are available to growers. Mineral fertilizers contain N in the form of urea, ammonium, nitrate or a mix of them. These N forms behave differently in the environment. Nitrate is very mobile in the soil and can easily be leached below the root zone with irrigation water or rain, especially in sandy soils. Urea is relatively mobile in the soil, but is generally quickly converted to ammonium. Ammonium is less mobile, but is generally converted quickly to nitrate by soil microorganisms in warm and moist soils, unless they are water saturated. This process, nitrification, can lower soil pH. The acidifying effect is especially strong when ammonium fertilizers are applied by drip systems as they are concentrated in a small soil volume [N23]. Ammonium and urea may be lost through ammonia volatilization, especially when applied to the surface of dry and alkaline soils without being incorporated.
A common N fertilizer for fertigation is UN 32 [N2], Other relatively soluble N fertilizers are urea, ammonium sulfate, and potassium nitrate [N19]. Anhydrous and aqua ammonia can also be used for fertigation. However, they cause an increase in water pH, which may result in a precipitate if the water contains calcium or magnesium. The high water pH also increases the risk of ammonia volatilization losses When, lime may precipitate when calcium nitrate is used with water with a high bicarbonate concentration [N19].
Foliar N
Foliar N
Nitrogen uptake from foliar applications is insufficient to fulfill total N needs by the trees. However, foliar N applications may supplement soil applied fertilizer, especially when soil conditions are not supportive and when demand is high [N9]. In a study carried out in an orchard with 14-year old ‘Kerman’ trees located in Madera County, the foliar application of KNO3 or low-biuret urea increased leaf N concentrations for about 3 weeks following the application late in April. Urea was more effective than KNO3 [N9].
Foliar applications of solutions with high N concentrations may cause leaf burn. The application of 100 and 200 gallons/acre of low-biuret urea solution (1.5% N) was found to cause significant leaflet burn. With these two treatments, 12.5 and 23.4 lbs N were applied per acre [N13]. In another study, the application of a low-biuret urea solution with an N concentration of 0.43% and a KNO3 solution with an N concentration of 0.14% (both solutions were prepared by dissolving 4.5 lbs of material in 50 gallons of water) caused some leaf burn [N9].
The foliar application of low-biuret urea together with cytokinin (6-benzyoadenin [MaxCel®]) or algal extract cytokinin [Binary CQ®] increased bud retention. The foliar fertilizers were applied three times, namely at fruit set, initiation of embryo growth and beginning of rapid embryo growth [N13]. The treatments also increased fruit yield in 'off' years. However, the yield in the 'off' year was still considerably lower than in the preceding 'on' year.
Soil Test
Soil Analysis
Soil Sampling and Analysis
Soil samples for nutrient analysis should be taken from the main root zone. Pistachio trees have an extensive root system with a taproot which allows them to extract water and nutrients from deep soil layers [P9]. However, most of the water and nutrients are taken up from the top 2 feet of the profile; especially in orchards with small but frequent irrigation water applications [P13]. When the soil samples are also used to assess soil salinity, sampling to a depth of 4 feet may be required [P16]. For more information on sampling procedure see Soil Sampling in Orchards.
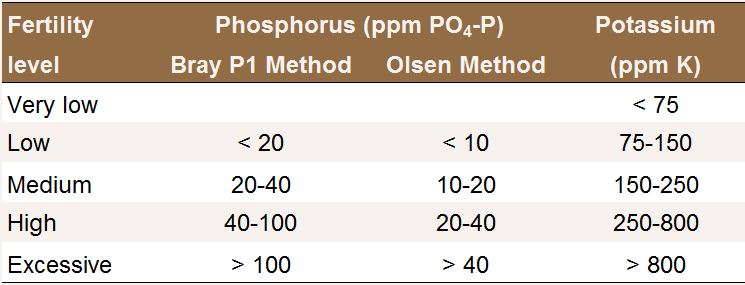
Phosphorus availability strongly depends on soil pH. In acidic soils, P is immobilized by iron and aluminum minerals, while the predominant mechanism of P immobilization in alkaline soils is the formation of insoluble calcium phosphate compounds. For this reason, the recommended soil test depends on soil pH. For acidic to neutral soil (pH < 7.0), the Bray P1 test is generally used. For neutral and alkaline soils (pH > 6.5), the Olsen method is more appropriate [P10]. Using a test that is inappropriate for the soil analyzed may result in inaccurate results.
Interpretation of Results
Interpretation of P and K soil test results in
orchards [P10].
When soil or leaf analyses suggest that P fertilization may be beneficial, the application rate can be based on the amount of P removed with harvested nuts each year (See Soil Applied P).
Leaf Analysis
Summer Leaf Analysis
Sampling Procedure
The following sampling procedure is recommended to determine the nutrient status of an orchard [P2]:
- If variable, divide your orchards into uniform blocks and take separate samples for each block.
- Take samples from late July through August.
- Randomly collect fully expanded sub-terminal leaflets from non-fruiting branches at about six feet from the ground.
- Sample 10-20 trees in each orchard block.
- Collect 4-10 leaves per tree.
- Do not sample leaves that have received in-season foliar nutrient applications for the elements of interest. This is especially important for micronutrients.
- Keep samples in labeled paper bags and submit them to the analytical lab within 24 hours of collection.
Interpretation of Results
Leaf nutrient concentrations change during the
season and may differ between leaves on the same tree depending on their location. The values in the table are based on leaves
sampled from late July through August following the sampling procedure outlined above. When good
trees are compared with poor ones, samples can be
taken anytime.
Critical and optimal nutrient concentrations in
pistachio leaves sampled from late July through
August [P2, P4, P21].
When leaf nutrient concentrations at or below the critical values, yield is 95% or less than the maximum and deficiency symptoms may be present. When the nutrient concentration is in the suggested range, tree growth and yield should be optimal provided other growth parameters are not limiting [P2].
P
P Fertilization of Young Trees
Phosphorus deficiency has rarely been observed in deciduous orchards in California. A soil test conducted before the trees are planted and regular leaf analyses will indicate whether P applications may be beneficial (See Soil P Test and Leaf P Analysis). Contact your local farm advisor for more information.
For almonds it has been recommended to use blends such as 15-15-15 or 12-12-12 to first and second-leaf trees to promote root growth [P8, P11]. The amount of fertilizer added is generally based on the N demand.
Research with walnuts has shown that applying P fertilizer in 6-inch deep trenches is more effective than broadcast applications [P18, P19]. The trenches can be 2 or more feet away from the trunk, depending on tree size [P18, P19]. However, the trenches need to be within the wetting zone of the irrigation system.
Soil Applied P
Soil Applied P
Phosphorus deficiency has rarely been observed in deciduous orchards in California. There are currently no University of California recommendations for P fertilization of pistachio orchards. Soil and leaf analyses can be used to monitor the P status of an orchard over the years to ensure that the P availability is adequate (See Soil P Test and Leaf P Analysis).
Application Rate
On the long term, the amount of P removed at harvest needs to be replaced with fertilizer to maintain adequate P availability. Approximately 3 lbs P (7 lbs P2O5) are removed from the orchard per 1000 lbs of marketable yield (CPC). This value includes all nutrients removed in hulls, shells and kernels, blank nuts and other non-marketable yield per 1000 lbs of marketable yield [P4, P5].
For low soil or leaf P values, higher application rates may be required, while for high values application rates can be reduced (see Soil P Test). Contact your local farm advisor for more information.
Dormant 21-year old trees contained roughly 270 g P in their permanent structures. Assuming a tree density of 120 trees/acre and a linear increase in P content over time, about 8.3 lbs P2O5/acre (3.6 lbs P/acre) are needed for new permanent structures every year. However, the P content has been found to be higher in trees after an 'off' than in trees after an 'on' year. The P accumulated in 'off' years is depleted in support of the large fruit demand during 'on' years [P6].
Time of Application
In 'on' years, only 5% of P was taken up during spring flush (mid-March to late May) while 95% was taken up during nut fill. In 'off' years, P uptake during spring flush accounted for 36% of total uptake. P uptake between harvest and leaf senescence was negligible [P14]. Thus, P must be available during the nut fill period [P15].
As P is immobile in the soil and is barely leached, the time of application is not as crucial as it is for N. Phosphorus is often applied in November after leaf drop begins. In acidic or alkaline soils, however, P can be strongly fixed by soil minerals. Under these conditions, applying P closer to the time of demand may be more effective. Contact your local farm advisor for more information.
Mode of Application
Broadcast applications of P have been found to be less effective than strip or ring applications at the drip-line of the tree [P3].
As P is immobilized by soil minerals, it is not leached into the root zone with irrigation or rainwater and should be incorporated into the soil for better availability. Phosphorus fertilizers can be drilled 6 to 8 inches deep in one or two bands on opposite sides of the tree row [P3].
Phosphorus can be fertigated; however care must be taken to prevent the formation of calcium phosphates which can plug the emitters [P7].
Fertilizer Type
A number of granular and liquid P fertilizers are available. Fact sheets of the most common fertilizers can be found on the web site of the International Plant Nutrition Institute.
Soil Test
Soil Analysis
Soil Sampling and Analysis
Soil samples for nutrient analysis should be taken from the main root zone. Pistachio trees have an extensive root system with a taproot which allows them to extract water and nutrients from deep soil layers [K8]. However, most of the water and nutrients are taken up from the top 2 feet of the profile; especially in orchards with small but frequent irrigation water applications [K12]. When the soil samples are also used to assess soil salinity, sampling to a depth of 4 feet may be required [K17]. For more information on sampling procedure see Soil Sampling in Orchards.
Interpretation of Results
The ammonium acetate extraction method is the most
common method to determine soil K availability (see
Table).
Interpretation of P and K soil test results in
orchards [K9].
Pistachio trees growing on soils with extractable K concentrations of less than 150 ppm in the root zone are most likely to respond to K fertilization. Trees on soils with extractable K levels between 150 and 250 ppm are less likely to respond to K fertilization. Combining soil and plant tissue testing helps monitoring trends in K nutrition and guiding management decision [K9].
Leaf Analysis
Spring Leaf Analysis
Recent research has resulted in the Pistachio Prediction Model, which uses nutrient analysis of spring leaf samples collected in May to predict late summer nutrient concentrations of N and K. Sampling done early in the season provides information for in-season fertilizer adjustments.
Sampling Procedure
The following leaf sampling protocol is recommended [K7, K16]:
- If variable, divide your orchards into uniform blocks and take separate samples for each block.
- Collect leaves from non-fruiting, exposed branches.
- Collect 10 leaves per tree at 6-7 feet height, from around the tree canopy.
- Sample at least 18 trees, at a distance of 25 yards from an orchard block.
- Collected leaves may be pooled in one bag for analysis.
- Leaf samples should be collected between 30-45 days after full bloom.
- The sample needs to be analyzed for N, P, K, Ca, Cu, and Mg.
The concentrations of all analyzed nutrients and the time of sampling (days after bloom) can be entered into the Pistachio Prediction Model, which can be found here.
Interpretation of Results
The predicted July/August N and K concentrations can be interpreted as described for samples taken in July.
Leaf Analysis
Summer Leaf Analysis
Sampling Procedure
The following sampling procedure is recommended to determine the nutrient status of an orchard [K5]:
- If variable, divide your orchards into uniform blocks and take separate samples for each block.
- Take samples from late July through August.
- Randomly collect fully expanded sub-terminal leaflets from non-fruiting branches at about six feet from the ground.
- Sample 10-20 trees in each orchard block.
- Collect 4-10 leaves per tree.
- Do not sample leaves that have received in-season foliar nutrient applications for the elements of interest. This is especially important for micronutrients.
- Keep samples in labeled paper bags and submit them to the analytical lab within 24 hours of collection.
Interpretation of Results
Leaf nutrient concentrations change during the
season and may differ between leaves on the same tree depending on their location. The values in the table are based on leaves
sampled from late July through August following the sampling procedure outlined above. When good
trees are compared with poor ones, samples can be
taken anytime.
Critical and optimal nutrient concentrations in
pistachio leaves sampled from late July through
August [K5, K6, K20].
When leaf nutrient concentrations at or below the critical values, yield is 95% or less than the maximum and deficiency symptoms may be present. When the nutrient concentration is in the suggested range, tree growth and yield should be optimal provided other growth parameters are not limiting [K4].
K
K Fertilization of Young Trees
Little information is available about the K demand of young pistachio trees. A soil test before orchard establishment combined with annual leaf analyses help determine whether K fertilization is needed.
In areas where soils are known to fix K, such as the east side of the San Joaquin Valley, analyzing the soil for its K fixation capacity before the orchard is planted helps planning the K fertilization program. A discussion about K fixation in the San Joaquin Valley can be found here. For more information about soil K availability in your area, contact your local farm advisor.
Soil Applied K
Soil Applied K
Adequate K availability is important to achieve a high yield, but also for nut quality, as K can increase nut weight, percentages of split nuts and reduce the number of blank and stained nuts [K21].
Application Rate
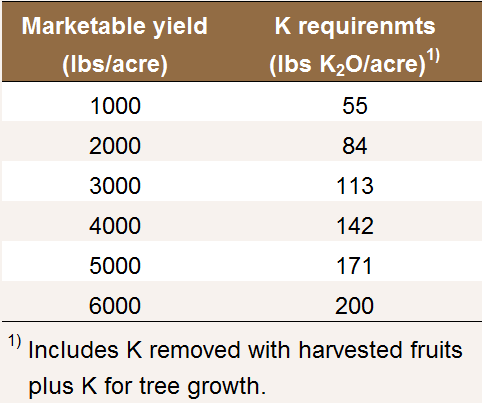
In field trials established in four orchards with 9-15 year old 'Kerman' pistachio trees located in the southern San Joaquin Valley, Brown and Siddiqui [K6, K7] found that on average 24 lbs of K (29 lbs K2O) are removed from the orchard per 1000 lbs of marketable yield (CPC). This value includes all nutrients removed in hulls, shells and kernels, blank nuts and other non-marketable yield per 1000 lbs marketable yield [K6, K7].
In addition, K is needed to support tree growth
requirements. On average, K uptake was found to
exceed removal with fruits and abscised leaves by 82
g K per tree and year [K13].
In an orchard with 120 trees per acre, this
corresponds to about 26 lbs K2O.
Estimated K requirements as affected by yield [K6, K7, K13].
Higher K application rates may be required for trees grown on soils with a low K availability or on K fixing soils (see K fixation in the San Joaquin Valley). In a study in Madera County with 15-year old 'Kerman' pistachio trees grown on a soil with low K availability, K application rates of 240 lbs K2O/acre (200 lbs K/acre) resulted in the highest yields (3200 lbs/acre). Higher application rates, however tended to decrease nut yield, possibly due to a decreased uptake of Mg and Ca caused by high soil K availability [K21]. A negative relationship between pistachio yield and high leaf K concentrations in combination with a low plant Mg status was also observed in recent trials (Siddiqui, personal communication).
In contrast, young alluvial soils such as those on the west side of the San Joaquin Valley are very high in exchangeable K, and a response to K fertilization is less likely, unless confounded by salinity or extremely light texture [K4].
Time of Application
Potassium demand and uptake are high during nut fill (late May to early September). In 'on' and 'off' years, more than 90% of K is taken up during nut fill. Therefore, a sufficient supply of K to the tree during this period is critical for satisfactory nut filling [K13, K14, K21].
Independent of crop load, seasonal K uptake and removal are balanced, indicating that little K is stored in permanent structures to be used in the subsequent year [K14].
Beede [K2] suggested K applying 40% of the seasonal demand in May, 40% in June, and 20% in July through the drip system.
Mode of Application
In a study carried out in three orchards with low K availability over two seasons, nut yield tended to be higher when K was applied via microsprinklers as compared to banding on the soil surface [K18, K19].
Band applications are more effective than broadcast applications, especially on soils with a high K fixation capacity. Applying the K in a band saturates the exchange complex of the clay and provides more K in soil solution for uptake [K3].
Fertilizer Type
Potassium sulfate (K2SO4), potassium chloride (KCl) and potassium nitrate (KNO3) did not differ in their effects on leaf K concentration, nut yield, and quality of 'Kerman' pistachios grown in Madera County. The use of KCl as a K source for 3 years did not increase leaf Cl concentration [K21]. However, orchard health, soil permeability, salinity, stratification and deficit irrigation need to be considered before applying large amounts of KCl [K3].
Foliar K
Foliar K
Little data about possible benefits of foliar K applications for pistachios are available. The quantity of K required by pistachio is likely too large to be supplied through the leaves. Foliar K applications may supplement soil applied K to alleviate deficiency when root uptake is insufficient, e.g. in K fixing soils or when demand exceeds supply, especially during nut fill.
In a study carried out in Iran, Sajjadinia and coworkers [K15] reported that foliar K application reduced the percentage of blank, small and deformed nuts, while the percentage of split pistachios was increased [K15]. The same effects were observed with foliar micronutrient applications.
Acknowledgments
Guidelines and Webpage Design:
- Daniel Geisseler, Ph.D.; Post Doctoral Scientist; Department of Land, Air and Water Resources, University of California, Davis
Reviewers:
- Muhammad Ismail Siddiqui; Ph.D. Candidate; Department of Plant Sciences, University of California, Davis
- William R. Horwath, Ph.D.; Professor of Soil Biogeochemistry and James G. Boswell Endowed Chair in Soil Science; Department of Land, Air and Water Resources, University of California, Davis
Support:
- Amadou Ba, Ph.D.; Branch Chief Feed,
Fertilizer, and Livestock Drugs Regulatory Services,
California Department of Food and Agriculture
- Amrith Gunasekara, Ph.D.; Science Advisor to the Secretary; California Department of Food and Agriculture
Last Update: April, 2015
Additional Information:
Links:
References:
TOP OF PAGE
Nitrogen
- Beede, B., 2014. March, 2014 tasklist for pistachios. UCCE Kings County Newsletter.
- Beede, B., 2014. May, 2014 Orchard task list for pistachios.
- Beede, B., Kallsen, C., 2008. How do I develop a sound pistachio nutrition management program?
- Beede, R.H., Brown, P., Kallsen, C., Weinbaum, S.A., 2005. Diagnosing and correcting nutrient deficiencies. In: Ferguson, L. (Ed.) Pistachio Production Manual, 4th Edition. pp. 147-157.
- Brown, P., Siddiqui, I., 2012. Development of leaf sampling and interpretation methods for pistachio and development of a nutrient budget approach to fertilizer management in pistachio. Pistachio Project Final Report.
- Brown, P., Siddiqui, I., 2013. Update 2013: Managing pistachio nutrition: Overview. Findings & recommendations.
- Brown, P.H., Weinbaum, S.A., Picchioni, G.A., 1995. Alternate bearing influences annual nutrient consumption and the total nutrient content of mature pistachio trees. Trees 9, 158-164.
- Doll, D., 2010. Tips for maximizing nitrogen use efficiency for almond.
- Ferguson, L., 1985. Effect of foliar urea applications on leaf nitrogen content and bud retention in pistachio. In: Pistachio Industry Annual Report 1985. pp. 94-95.
- Gonzalez, V., Uriu, K., 1995. Nutritional deficiency symptoms in pistachio. In: California Pistachio Industry Annual Report 1995. pp. 69-73.
- Gonzalez, V., Uriu, K., Crane, J., 1993. Development of nutritional deficiency symptoms in pistachio. In: California Pistachio Industry Annual Report 1993. pp. 78.
- Holtz, B., 2010. Fertilizing one-year old trees – Be careful!
- Lovatt, C.J., Daoudi, H., Ferguson, L., 2006. Efficacy of foliar-applied cytokinins and nitrogen to increase floral bud retention and to reduce alternate bearing of pistachio. Acta Horticulturae 727, 353-364.
- Niederholzer, F., 2011. Using urea efficiently.
- Niederholzer, F., 2012. Nitrogen use efficiency in almonds. Sacramento Valley Almond News, April 2012.
- Picchioni, G.A., Brown, P.H., Weinbaum, S.A., Muraoka, T.T., 1997. Macronutrient allocation to leaves and fruit of mature, alternate-bearing pistachio trees: Magnitude and seasonal patterns at the whole-canopy level. Journal of the American Society of Horticultural Science 122, 267-274.
- Rosecrance, R.C., Weinbaum, S.A., Brown, P.H., 1996. Assessment of nitrogen, phosphorus, and potassium uptake capacity and root growth in mature alternate-bearing pistachio (Pistacia vera) trees. Tree Physiology 16, 949-956.
- Sanden, B., Fulton, A., Ferguson, L., 2005. Managing salinity, soil and water amendments. In: Ferguson, L. (Ed.) Pistachio Production Manual, 4th Edition. pp. 129-146.
- Schwankl, L.J., 2005. Fertigation. In: Ferguson, L. (Ed.) Pistachio Production Manual, 4th Edition. pp. 158-163.
- Siddiqui, M.I., Brown, P., 2013. Pistachio prediction model. A new tool in nutrient management.
- Siddiqui, M.I., Brown, P., 2013. Pistachio early-season sampling and in-season nitrogen application maximizes productivity, minimizes loss.
- Weinbaum, S.A., Picchioni, G.A., Muraoka, T.T., Ferguson, L., Brown, P.H., 1994. Fertilizer nitrogen and boron uptake, storage, and allocation vary during the alternate-bearing cycle in pistachio trees. Journal of the American Society of Horticultural Science 119, 24-31.
- Zasoski, R.J., 1994. Nitrogen efficiency in drip irrigated almonds. FREP Final Report.
- Zeng, Q., Brown, P.H., Huang, Z., Holtz, B.A., Hornung, C., 1999. Agronomic and economic responses of mature Kerman pistachio (Pistacia vera L.) trees to potassium applications in California. In: Pistachio Industry Annual Report 1999. pp. 84-85.
Phosphorus
- Ashworth, L.J., Gaona, S.A., Surber, E., 1985. Nutritional diseases of pistachio trees: Potassium and phosphorus deficiencies and chloride and boron toxicities. Phytopathology 75, 1084-1091.
- Beede, R.H., Brown, P., Kallsen, C., Weinbaum, S.A., 2005. Diagnosing and correcting nutrient deficiencies. In: Ferguson, L. (Ed.) Pistachio Production Manual, 4th Edition. pp. 147-157.
- Beutel, J., Uriu, K., Lilleland, O., 1976. Leaf analysis for California deciduous fruits. In: Reisenauer, H.M. (Ed.) Soil and Plant-Tissue Testing in California. University of California Cooperative Extension Bulletin 1879. pp. 15-17.
- Brown, P., Siddiqui, I., 2012. Development of leaf sampling and interpretation methods for pistachio and development of a nutrient budget approach to fertilizer management in pistachio. Pistachio Project Final Report.
- Brown, P., Siddiqui, I., 2013. Update 2013: Managing pistachio nutrition: Overview. Findings & recommendations.
- Brown, P.H., Weinbaum, S.A., Picchioni, G.A., 1995. Alternate bearing influences annual nutrient consumption and the total nutrient content of mature pistachio trees. Trees 9, 158-164.
- California Plant Health Association, 2002. Western Fertilizer Handbook 9th Edition. Interstate Publishers, Inc.
- Doll, D., 2011. Fertilizing young almond trees – a few tips.
- Ferguson, L., Polito, V., Kallsen, C., 2005. The pistachio tree; botany and physiology and factors that affect yield. In: Ferguson, L. (Ed.) Pistachio Production Manual, 4th Edition. pp. 31-39.
- Fulton, A., 2010. Understanding and applying information from a soil test: Part 2 – NPK.
- Gonzalez, V., Uriu, K., 1995. Nutritional deficiency symptoms in pistachio . In: California Pistachio Industry Annual Report 1995. pp. 69-73.
- Holtz, B., 2010. Fertilizing one-year old trees – Be careful!
- Kanber, R., Yazar, A., Oender, S., Koeksal H., 1993. Irrigation response of pistachio (Pistacia vera L.). Irrigation Science 14, 7-14.
- Rosecrance, R.C., Weinbaum, S.A., Brown, P.H., 1996. Assessment of nitrogen, phosphorus, and potassium uptake capacity and root growth in mature alternate-bearing pistachio (Pistacia vera) trees. Tree Physiology 16, 949-956.
- Rosecrance, R.C., Weinbaum, S.A., Brown, P.H., 2002. Phosphorus and potassium nutrition of pistachio trees as affected by alternate-bearing. Better Crops 86(1), 18-22.
- Sanden, B., Fulton, A., Ferguson, L., 2005. Managing salinity, soil and water amendments. In: Ferguson, L. (Ed.) Pistachio Production Manual, 4th Edition. pp. 129-146.
- Schwankl, L.J., 2005. Fertigation. In: Ferguson, L. (Ed.) Pistachio Production Manual, 4th Edition. pp. 158-163.
- Serr, E.F., 1960. Walnut orchards on volcanic soils deficient in phosphorus. California Agriculture 14(6), 6-7.
- Serr, E.F., 1961. Nutritional deficiencies and fertilization practices in California walnut orchards. 52nd Annual Report of the Northern Nut Growers Association. pp 69-74.
- Siddiqui, M.I., Brown, P., 2013. Pistachio prediction model. A new tool in nutrient management.
- Zeng, Q., Brown, P.H., Huang, Z., Holtz, B.A., Hornung, C., 1999. Agronomic and economic responses of mature Kerman pistachio (Pistacia vera L.) trees to potassium applications in California. In: Pistachio Industry Annual Report 1999. pp. 84-85.
Potassium
- Ashworth, L.J., Gaona, S.A., Surber, E., 1985. Verticilliium wilt of pistachio: The influence of potassium nutrition on susceptibility to infection by Verticillium dahlia. Phytopathology 75, 1091-1093.
- Beede, B., 2014. May, 2014 Orchard task list for pistachios.
- Beede, B., 2014. June, 2014 Orchard task list for pistachios. UCCE Kings County Newsletter.
- Beede, B., 2014. July-August, 2014 Orchard task list for pistachios. UCCE Kings County Newsletter.
- Beede, R.H., Brown, P., Kallsen, C., Weinbaum, S.A., 2005. Diagnosing and correcting nutrient deficiencies. In: Ferguson, L. (Ed.) Pistachio Production Manual, 4th Edition. pp. 147-157.
- Brown, P., Siddiqui, I., 2012. Development of leaf sampling and interpretation methods for pistachio and development of a nutrient budget approach to fertilizer management in pistachio. Pistachio Project Final Report.
- Brown, P., Siddiqui, I., 2013. Update 2013: Managing pistachio nutrition: Overview. Findings & recommendations.
- Ferguson, L., Polito, V., Kallsen, C., 2005. The pistachio tree; botany and physiology and factors that affect yield. In: Ferguson, L. (Ed.) Pistachio Production Manual, 4th Edition. pp. 31-39.
- Fulton, A., 2010. Understanding and applying information from a soil test: Part 2 – NPK.
- Gonzalez, V., Uriu, K., 1995. Nutritional deficiency symptoms in pistachio. In: California Pistachio Industry Annual Report 1995. pp. 69-73.
- Gonzalez, V., Uriu, K., Crane, J., 1993. Development of nutritional deficiency symptoms in pistachio. In: California Pistachio Industry Annual Report 1993. pp. 78.
- Kanber, R., Yazar, A., Oender, S., Koeksal H., 1993. Irrigation response of pistachio (Pistacia vera L.). Irrigation Science 14, 7-14.
- Rosecrance, R.C., Weinbaum, S.A., Brown, P.H., 1996. Assessment of nitrogen, phosphorus, and potassium uptake capacity and root growth in mature alternate-bearing pistachio (Pistacia vera) trees. Tree Physiology 16, 949-956.
- Rosecrance, R.C., Weinbaum, S.A., Brown, P.H., 2002. Phosphorus and potassium nutrition of pistachio trees as affected by alternate-bearing. Better Crops 86(1), 18-22.
- Sajjadinia, A., Bazargan, H., Hokmabadi, H., Kefayati, M.E., Rajaee, S., 2011. The investigation of the effects of 17 fertilizers treatments in the form of foliar application on qualitative characteristics of pistachio nut cultivar 'Ouhadi'. Acta Horticulturae 912, 193-196.
- Sanden, B., Fulton, A., Ferguson, L., 2005. Managing salinity, soil and water amendments. In: Ferguson, L. (Ed.) Pistachio Production Manual, 4th Edition. pp. 129-146.
- Siddiqui, M.I., Brown, P., 2013. Pistachio prediction model. A new tool in nutrient management.
- Zeng, Q., Brown, P.H., Fairweather, T., Holtz, B.A., 1996. Potassium nutrition of pistachio: Development of potassium diagnostic procedures and fertilizer recommendations (first year report). Pistachio Industry Annual Report 1996. Pp. 135-138.
- Zeng, Q., Brown, P.H., Hornung, C., Holtz, B.A., 1997. Effects of potassium application on soil potassium availability, leaf potassium status, nut yield and quality in mature pistachio (Pistacia vera L.) trees. Pistachio Industry Annual Report 1997. pp. 90-96.
- Zeng, Q., Brown, P.H., Huang, Z., Holtz, B.A., Hornung, C., 1999. Agronomic and economic responses of mature Kerman pistachio (Pistacia vera L.) trees to potassium applications in California. In: Pistachio Industry Annual Report 1999. pp. 84-85.
- Zeng, Q., Brown, P.H., Holtz, B.A., 2001. Potassium fertilization affects soil K, leaf K concentration, and nut yield and quality of mature pistachio trees. HortScience 36, 85–89.