Walnut Fertilization Guidelines
Funding provided by:
- Young Trees
- Dormancy
Winter - Bloom
Spring - Fruit Development
Summer - Harvest
Fall
Nitrogen
(N) 
Walnut Nitrogen Nutrition
Deficiency Symptoms
In spring, N deficiency is characterized by unusually pale and small leaves. Shoot growth is reduced, resulting in sparse foliage. In autumn, leaves senesce early and the trees defoliate sooner than usual. Insufficient water availability may result in similar symptoms. Yield may decline before N deficiency symptoms are visible. Tree N status is therefore best monitored with leaf analyses [N17, N4].
Phosphorus
(P2O5)
Walnut Phosphorus Nutrition
Deficiency Symptoms
Phosphorus deficiency does not result in characteristic symptoms in walnuts. In general, leaf size and shoot length are reduced. Leaves may be yellow and irregular necrotic areas may develop. Leaves senesce early and the trees defoliate sooner than usual [P4, P15]. Typically, the basal leaflet pair drops first [P14]. For a clear diagnosis, visual symptoms are best confirmed with leaf analyses [P4, P15].
Affected Areas
Phosphorus deficiency in California is rare [P4]. Phosphorus deficiency has been described on Hesse and Glenview gravelly clay loams, and on Aiken clay loams, all of which are volcanic soils in Lake County [P14, P16]. For more information contact your local farm advisor.
Potassium
(K2O)
Walnut Potassium Nutrition
Deficiency Symptoms
Symptoms of K deficiency generally appear first in early summer to midsummer. Leaves turn pale and may resemble N deficient leaves. The edges of the leaflets of severely deficient trees fold upwards and curl in. The exposed undersides of the leaves develop grayish cast. Leaves along the middle of the shoots are most affected. Leaf size, shoot growth and nut size are reduced as a consequence of K deficiency [K4, K23]. For a clear diagnosis, visual symptoms are best confirmed with leaf analyses [K4].
Affected Areas
Potassium deficiency has been reported from the Chico area, the southwestern Santa Clara Valley, from sandy soils in the San Joaquin Valley and some soils of Santa Barbara County [K23]. On the east side of the San Joaquin Valley, soil may fix K (see K Fixation in the San Joaquin Valley). For more information contact your local farm advisor.
Leaf Analysis
Leaf Analysis
Walnut leaf analyses are more reliable for the diagnosis of nutrient deficiencies than soil analysis [N4].
Sampling Procedure
The N concentration in leaves generally decreases during the growing season. The least change occurs from late June through July. This is the time when leaf samples should be taken. Leaf nutrient concentrations also depend on the location of the leaf in the canopy. The following leaf sampling procedure has been recommended [N1, N2, N4]:
- Take leaf samples in July
- Sample terminal leaflets from fully expanded spur leaves
- Collect leaflets 6-8 feet above the ground from around the tree
- About 50 leaflets are required per sample
- Collect leaflets from 5-10 randomly selected trees throughout the orchard
- Divide the orchard into uniform blocks of trees with respect to soil type, age of trees, variety, and management. A separate sample should be submitted for analysis from each block.
- Avoid collecting from sick, injured or stunted trees.
The critical values refer to a tree. In contrast, the results from leaf analyses refer to the average of all trees sampled in the orchards with some trees being below and others above the average [N3]. For this reason it is important to divide an orchard into uniform blocks where the variability between trees is small.
Interpretation of Results
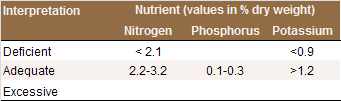
July leaf N concentrations below 2.1% suggest N
deficiency (see Table). The Western Fertilizer
Handbook recommends s sufficiency range of 2.3-2.8%
N [N6]. This is
in line with Weinbaum and coworkers [N21] who reported
that the yield of ‘Serr’ and ‘Hartley’ trees was
reduced when leaf N concentrations were at or below
2.3% dry weight. Leaf analyses are best interpreted
with visual symptoms and soil analyses [N4]. Leaf N
concentrations over 3.2% indicate N excess. In this
case, the N fertilization program should be
reevaluated.
Critical nutrient levels in walnut leaves sampled in
July [N2].
N
N Fertilization of Young Trees
Application Rate
Nitrogen is usually the only nutrient that may be
required the first year [N19].
On fertile soils, N fertilization can be reduced or
even omitted during the first year or two.
Nitrogen application rates for young trees. The
lower rates refer to fertile soils and when the N is
applied through the drip or microsprinkler
irrigation system [N1].
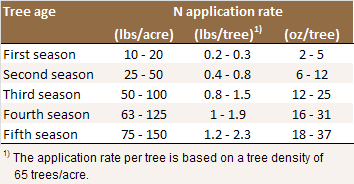
In a study with black walnut trees, N use efficiency and growth of first leaf trees were best with an application of 0.1 lb N/tree [N10].
Time and Mode of Application
Fertilizer is best applied to young trees in mid-spring and early summer [N19]. Late applications (after August) should be avoided to prevent late fall growth which could be susceptible to freeze injury [N12, N19]. Furthermore, N not taken up by leaf senescence is subject to leaching during the winter. Nitrogen fertilizer can be applied in the dry form or in the irrigation water [N19]. Avoid applying near the trunk [N12].
In general, the application of fertilizer or organic material into the planting hole is discouraged [N12]. On a high fertility soil, the application of fertilizer blend containing N, P, K and different micronutrients into the planting hole or mixed into the soil used to fill the holes had minimal effect on tree growth and leaf nutrient levels in the first year [N15, N18]. The amounts of nutrients applied per tree with the different treatments were: 16-54 g N, 14-27 g P2O5 and 5-23 g K2O.
Fertilizer Type
Little is known about the effects of different fertilizer types on young walnut trees. For almonds, Brent Holtz [N11] recommends using granular fertilizers for first-leaf trees, because the risk of root burn is increased with liquid fertilizers, as their application may result in high concentrations in the root zone. To second-leaf trees, liquid fertilizers, such as UN-32 or CAN-17 can be applied.
Soil Applied N
Soil Applied N
Application Rate
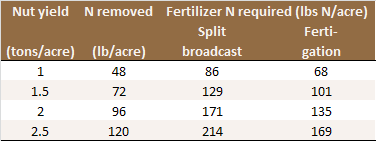
About 40 lbs N is removed from the orchard per ton of in-shell walnuts harvested. An additional 20% (8 lbs N/acre) may be lost from the tree in the abscised leaves and prunings [N21]. Furthermore, the N stored in the woody tree parts increases by approximately 15 lbs N/acres per year. This number is based on a study with ‘Hartley’ walnuts, where N stored in the branches, roots and trunks of dormant 16-year old trees was measured [N20, N21], and assumed a linear increase in N storage over time.
The amount of fertilizer N required not only depends on yield, but also on other N sources available and the efficiency with which the fertilizer N is used by the trees (see Table). Irrigation water can be a significant source of N. 27 lbs N/acre are applied with one acre-foot of water containing 10 ppm nitrate-N. Part of the N in organic amendments and cover crops is also available and needs to be taken into account.
An online N fertilization model for walnuts is available here. The model adjusts the N application rate based on yield, the efficiency of the irrigation system, nitrate-N in the irrigation water and N supplied with organic amendments, such as cover crop, manure or compost [N5].
Additional information and an N budget worksheet
can be found in the UC ANR publication “Guide to Efficient Nitrogen
Fertilizer Use in Walnut Orchards”.
Nitrogen application rates based on yield and N use
efficiency of the irrigation system [N5, N21].
Time of Application
Virtually no N is taken up during winter [N21]. Earlier studies conducted in Tehama County suggested large overwinter losses of fall-applied N [N16]. Nitrogen uptake is still low in early spring, as more than half the N needed during bloom spur leaf expansion is derived from storage in perennial tissue [N8]. N uptake is greatest from between the onset of shoot growth and the latter stages of nut fill, which roughly corresponds to the period from early April to late July/early August [N1].
Approximately 60% of the annual N demand is derived from N redistributed from woody tree parts [N20]. For this reason, the exact time of application may not be as crucial as it is for annual crops, as long as the fertilizer is applied during a period of active uptake. However, N should not be applied after late June or early July to ensure that it is available before nut fill is complete [N1].
To provide sufficient N for the period of high uptake, Anderson and coauthors [N1] recommended applying one half to two thirds of the N in spring and the remainder in summer, while the N fertilization model for walnuts suggests applying 5% of the seasonal N requirements in March/April, 25% in May/June and 70% in June/July [N5]. Richardson and Meyer [N16] found no statistically significant difference in yield when N was split into two applications in May and August as opposed to a single application in March or August. However, yield was not related to application rate neither suggesting that the soil at the study site supplied a large proportion of the N needed and that yield did not depend on fertilzer N.
When fertigation is possible, the most efficient way to apply N is in small amounts between the onset of shoot growth and nut fill. This practice has been shown to be very beneficial to the health of the trees, while reducing N losses [N7].
Mode of Application
Fertilizers are best applied in the herbicide strip along the tree rows and not broadcast over the entire area. Fertilizer applied between the rows is less efficiently used due to competition with weeds or cover crops and lower root density compared to the tree row [N14].
Surface-applied dry or liquid urea and ammonium fertilizer must be incorporated as soon as possible to prevent ammonia volatilization losses [N9, N13].
Fertilizer can be band applied in strips 12 to 18 inches wide under the trees along the row [N1]. The bands need to be within the wetting zone of the irrigation system. Subsurface drilling is not recommended in non-tilled orchards because the drilling equipment may damage tree roots [N1].
In microsprinkler irrigated orchards, fertigation is the most effective way to apply N fertilizer [N1]. The fertilizer should be injected into the irrigation system in the middle third of the irrigation set. For example, in a 18-hour irrigation set, fertilizer is injected from hour 6 through hour 12. This prevents urea and nitrate from moving below the root zone but still ensures that the N is distributed well in the wetting zone and does not remain in the irrigation system [N13].
Fertilizer Type
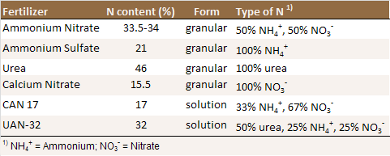
A number of mineral N fertilizers are available to
growers (see Table). Mineral fertilizers contain N
in the form of urea, ammonium, nitrate or a mix of
them. When losses are minimized and equal amounts of
N are added, the effects on yield of these
fertilizers are generally quite similar [N1]. Early work
showed that ammonium sulfate, ammonium nitrate,
anhydrous ammonia and aqua ammonia can be used in
walnut production [N17].The
N forms, however, behave differently in the
environment. Nitrate is very mobile in the soil and
can easily be leached below the root zone with
irrigation water or rain. Urea is relatively mobile
in the soil, but is generally quickly converted to
ammonium. Ammonium is less mobile, but is generally
converted quickly to nitrate by soil microorganisms
in warm and moist soils, unless they are water
saturated. This process, nitrification, can lower
soil pH. The acidifying effect is especially strong
when ammonium fertilizers are applied by drip
systems as they are concentrated in a small soil
volume [N22].
Ammonium and urea may be lost through ammonia
volatilization, especially when applied to the
surface of dry and alkaline soils without being
incorporated.
Composition of N fertilizers commonly used for
walnuts [N1, N7].
Soil Test
Soil Analysis
Soil Sampling and Analysis
Soil samples for P analysis should be taken from the main root zone. Even though walnut roots may grow to a depth of 6 to 7 feet, the majority of the roots can be found in the top 2-3 feet of the profile [P6]. For detailed sampling instructions see Soil Sampling in Orchards.
Phosphorus availability strongly depends on soil pH. In acidic soils, P is immobilized by iron and aluminum minerals, while in alkaline soils the predominant mechanism of P immobilization is the formation of insoluble calcium phosphate compounds. For this reason, the recommended soil test depends on soil pH. For acidic to neutral soil (pH < 7.0), the Bray P1 test is generally used. For neutral and alkaline soils (pH > 6.5), the Olsen method is more appropriate [P8]. Using a test that is inappropriate for the soil analyzed may result in inaccurate results.
Interpretation of Results
For intermediate soil P values (see Table), applying the amount of P removed at harvest ensures the soil P availability remains at an optimal level over the years. Approximately 4.3 lbs (10 lbs P2O5) are removed with one ton of nuts. Higher application rates are required when trees show symptoms of P deficiency (See P Fertilization). In contrast, little or no P fertilizer is required when soil P availability is high. Regular soil and leaf analyses indicate whether the P fertilization program is adequate.
In acidic and alkaline soils, low P availability
should first be addressed by correcting the pH of
the soil. Phosphorus availability is highest in
soils with a pH close to neutral (pH 7). Contact
your local farm advisor for more
information.
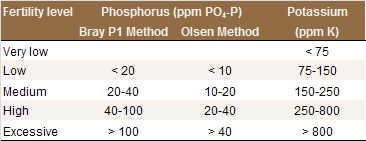
Interpretation of soil P and K test results for
orchards [P8].
Leaf Analysis
Leaf Analysis
Walnut leaf analyses are more reliable for the diagnosis of nutrient deficiencies than soil analysis [P4].
Sampling Procedure
The P concentration in leaves generally decreases during the growing season. The least change occurs from late June through July. This is the time when leaf samples should be taken. Leaf nutrient concentrations also depend on the location of the leaf in the canopy. The following leaf sampling procedure has been recommended [P1, P2, P4]:
- Take leaf samples in July
- Sample terminal leaflets from fully expanded spur leaves
- Collect leaflets 6-8 feet above the ground from around the tree
- About 50 leaflets are required per sample
- Collect leaflets from 5-10 randomly selected trees throughout the orchard
- Divide the orchard into uniform blocks of trees with respect to soil type, age of trees, variety, and management. A separate sample should be submitted for analysis from each block.
- Avoid collecting from sick, injured or stunted trees.
The critical values refer to a tree. In contrast, the results from leaf analyses refer to the average of all trees sampled in the orchards with some trees being below and others above the average [P3]. For this reason it is important to divide an orchard into uniform blocks where the variability between trees is small.
Interpretation of Results
July leaf P concentrations below 0.1% suggest P
deficiency (see Table). Leaf analyses are best
interpreted in combination with visual symptoms and
soil analyses [P4].
Critical nutrient levels in walnut leaves sampled in
July [P2].
Very little is known about the effects of rootstocks on leaf nutrient concentrations. One study reported that under identical growing conditions, leaf P levels were found to be higher and K concentrations lower on trees on Paradox rootstocks compared to trees on N.C. Black rootstocks [P13].
P
P Fertilization of Young Trees
In most cases, N is the only element required by new trees in most California soils [P17]. On P fixing soils, the application of 25 lbs triple superphosphate per tree (11 lbs P2O5) has been found to alleviate P deficiency of 2 to 10 year old trees for at least 5 years [P16].
Applying P fertilizer in 6-inch deep trenches is more effective than broadcast applications [P14, P15]. The trenches can be 2 or more feet away from the trunk, depending on tree size [P14, P15]. However, the trenches should be within the wetting zone of the irrigation system.
Soil Applied P
Soil Applied P
Application Rate
Approximately 4.3 lbs (10 lbs P2O5) are removed with one ton of harvested nuts. This amount is based on the following assumptions: shell P concentration of 0.076% [P7], kernel P concentration of 0.363% [P9, P10, P11, P12], and kernel ratio of 49% [P5]. In the long term, this amount should be replaces with fertilizer to maintain the soil P availability at the same level.
Higher application rates are required when trees show symptoms of P deficiency. On P fixing soils in Lake County, P deficiency symptoms could be alleviated and yields increased with a triple superphosphate (0-45-0) application of 25 lbs per young tree (2 to 10 years old) or 50-100 lbs for mature trees [P16]. The treatments alleviated P deficiency for at least 5 years.
Mode of Application
Broadcast surface applications are not effective, especially on soils that fix P [P14]. Application in 6-inch deep trenches, 2 to 10 feet away from the trunk, depending on tree size, have been found more effective [P14, P15]. The trenches should be within the wetting zone of the irrigation system, so that roots can access the P.
Fertilizer Type
Triple superphosphate has been shown to be effective [P14, P16]. Facts sheets about the most common fertilizers can be found on the International Plant Nutrition Institute (IPNI) homepage.
Time of Application
Phosphorus fertilizer is generally applied during the dormant period in fall or winter [P16].
Soil Test
Soil Analysis
Soil Sampling and Analysis
Soil samples for K analysis should be taken from the main root zone. Even though walnut roots may grow to a depth of 6 to 7 feet, the majority of the roots can be found in the top 2-3 feet of the profile [K7]. For detailed sampling instructions see Soil Sampling in Orchards. Potassium availability is generally assessed by extracting a soil sample with ammonium acetate.
Interpretation of Results
A response to K fertilization is likely when the extractable K is below 150 ppm (see Table). Walnuts growing on soils with extractable K values of 150 ppm or higher are not likely to respond to K fertilization [K9].
For intermediate soil K values (see Table), applying the amount of K removed at harvest ensures the soil K availability remains at an optimal level over the years. Approximately 15 lbs K2O are removed with one ton of nuts. If the hulls are not returned to the field, approximately 230 lbs K2O/acre are removed with one ton of dry hulls. Higher application rates are required when trees show symptoms of K deficiency (See K Fertilization). In contrast, little or no K fertilizer is required when soil K availability is high.
Regular soil and leaf analyses indicate whether
the K fertilization program is adequate. Contact
your local farm advisor for more
information.
Interpretation of soil P and K test results for
orchards [K9].
Leaf Analysis
Leaf Analysis
Walnut leaf analyses are more useful for the diagnosis of nutrient deficiencies than soil analysis [K4].
Sampling Procedure
The concentration of N, P and K in leaves generally decreases during the growing season. The least change occurs from late June through July. This is the time when leaf samples are taken. Leaf nutrient concentrations also depend on the location of the leaf in the canopy. The following leaf sampling procedure has been recommended [K1, K2, K4]:
- Take leaf samples in July
- Sample terminal leaflets from fully expanded spur leaves
- Collect leaflets 6-8 feet above the ground from around the tree
- About 50 leaflets are required per sample
- Collect leaflets from 5-10 randomly selected trees throughout the orchard
- Divide the orchard into uniform blocks of trees with respect to soil type, age of trees, variety, and management. A separate sample should be submitted for analysis from each block.
- Avoid collecting from sick, injured or stunted trees.
The critical values refer to a tree. In contrast, the results from leaf analyses refer to the average of all trees sampled in the orchards with some trees being below and others above the average [K3]. For this reason it is important to divide an orchard into uniform blocks where the variability between trees is small.
Interpretation of Results
July leaf K concentrations below 0.9% suggest K
deficiency (see Table). Research by Olson [K13] suggested
that the lower limit of the optimal July leaf K
concentration is 1.4-1.5% and therefore higher than
indicated in the table. Leaf analyses are best
interpreted with visual symptoms and soil analyses [K4].
Critical nutrient levels in walnut leaves sampled in
July [K2].
Very little is known about the effects of rootstocks on leaf nutrient concentrations. One study reported that under identical growing conditions, leaf P levels were found to be higher and K concentrations lower on trees on Paradox rootstocks compared to trees on N.C. Black rootstocks [K22].
K
K Fertilization of Young Trees
In most cases, N is the only element required by new trees in most California soils [K24]. Exceptions may be soils with very low levels of available K, such as very sandy or K fixing soils.
Soil Applied K
Soil Applied K
Application Rate
The amount of K removed with one ton of harvested nuts is approximately 12 lbs (15 lbs K2O). The hulls contain a high concentration of K. If they are not returned to the field, approximately 35-40 lbs K (40-50 lbs K2O) are removed with the hulls of one ton of in-shell nuts (see below for calculations).
By replacing with fertilizer the amount of K removed at harvest, soil K availability can be maintained at the same level over the years. Higher application rates are required when trees are K deficient. Annual band applications of 240 lbs K2O/acre have been recommended to K deficient trees grown on sandy soil [K17, K14]. On heavier clay or silt loam soils, up to 900 lbs K2O/acre may be required to alleviate K deficiency. In these trials, carried out in the 1980s, adequate levels of K could be maintained with annual applications of 240 lbs K2O/acre once deficiency was corrected [K16, K4].
Potassium fertilization to deficient trees may not
show any effect until the second season after the
application [K10, K14,
K15].
How the amount of K removed at harvest was
calculated:
The amount of K removed with in-shell nuts is based on the following assumptions: Shell K concentration of 0.77% [K8], kernel K concentration of 0.45% [K12, K19, K20, K21], and kernel ratio of 49% [K5].
The following assumptions were used to calculate the amount of K removed with the hulls: K concentration of dry hulls: 9.6% [K18]; hulls account for 50-60% of the fresh weight of hulled walnuts; hull moisture content of 88% [K11]; moisture content of hulled shells and kernels: 35% [K11], moisture content of dried nuts: 8% (moisture contents in % of moist weight).
Mode of Application
Potassium fertilizer can be banded on either side of the tree or supplied with the irrigation water [K4].
Band applied K fertilizer penetrates the soil to deeper depths and is a more efficient way to apply K than broadcast [K16]. Band applied K has also been found to correct K deficiency more effectively than when applied with the sprinkler system [K17].
In a K deficient walnut orchard grown on a sandy loam, the application of K in a wide band in one pass per tree row was equally effective as the application of two bands on both sides of the tree rows [K14].
Fertilizer Type
Potassium chloride (KCl) or potassium sulfate (K2SO4) can be applied [K4]. A study in an orchard on a potentially K-fixing soil showed that the two materials performed equally well in increasing and sustaining leaf K concentrations [K10]. In the same study, band application of 630 to 1890 lbs K2O/acre in the form of KCl to 8-year old walnut trees resulted in elevated leaf chloride levels the season after the application.
Therefore, when repeated high doses of K are required, K2SO4 should be favored over KCl to prevent a buildup of chloride in the root zone [K4]. Applying KCl on soils with clay pans or high water tables which do not allow adequate leaching of the Cl from the root zone is also not recommended [K6].
Time of Application
Soil applications are generally done in the fall to allow winter rains to move K into the root zone [K6]. When KCl is used, applying the material in fall also allows winter rains to leach chloride ions, which move much more freely in the soil than K ions, out of the root zone [K10].
With the exception of very sandy soils, K is not leached below the root zone. It is therefore possible to apply a larger dose of K fertilizer every three to five years instead of smaller annual applications [K6].
Foliar K
Foliar K
The effects of foliar K applications to walnuts have not been studies widely. Olson and coworkers [K16] reported no benefits from foliar K sprays on walnuts.
Soil K applications to deficient trees may not alleviate deficiency until the second season after the application [K10, K14, K15]. In this case a foliar application during the first season might be beneficial [K6].
Covert and Connell [K6] recommend using potassium nitrate (KNO3).
Acknowledgments
Guidelines and Webpage Design:
- Daniel Geisseler, Ph.D.; Post Doctoral Scientist; Department of Land, Air and Water Resources, University of California, Davis
Reviewers:
- Joseph A. Grant; Farm advisor; University of California Cooperative Extension San Joaquin County
- Katherine S. Pope, Ph.D.; Post Doctoral Scientist; Department of Plant Sciences, University of California, Davis
- William R. Horwath, Ph.D.; Professor of Soil Biogeochemistry and James G. Boswell Endowed Chair in Soil Science; Department of Land, Air and Water Resources, University of California, Davis
Support:
- Asif Maan, Ph.D.; Branch Chief Feed,
Fertilizer, and Livestock Drugs Regulatory Services,
California Department of Food and Agriculture
- Amrith Gunasekara, Ph.D.; Science Advisor to the Secretary; California Department of Food and Agriculture
- Erika Lewis; Fertilizer Reserach and Education Program, California Department of Food and Agriculture
Last Update: March, 2014
Additional Information:
Links:
References:
TOP OF PAGE
Nitrogen
- Anderson, K.K., Grant, J., Weinbaum, S.A., Pettygrove, S., 2006. Guide to efficient nitrogen fertilizer use in walnut orchards. University of California, Agriculture and Natural Resources. Publication 21623.
- Beutel, J., Uriu, K., Lilleland, O., 1976. Leaf analysis for California deciduous fruits. In: Reisenauer, H.M. (Ed.) Soil and Plant-Tissue Testing in California. University of California Cooperative Extension Bulletin 1879. pp. 15-17.
- Brown, P., 2009. Are critical values for nutrient management in almond and pistachio orchards invalid? Fluid Journal 17(3), Issue #65.
- Brown, P.H., Uriu, K., 1998. Nutritional deficiencies and toxicities in walnut: Diagnosis and correcting imbalances. In: Ramos, D.E. (Ed.) Walnut Production Manual. University of California Division of Agriculture and Natural Resources. Publication 3373. pp. 187-196.
- Brown, P.H., Zhang, Q., Stevenson, M., Rosecrance, R.C. Nitrogen Fertilization Recommendation for Walnut.
- California Plant Health Association, 2002. Western Fertilizer Handbook 9th edition. Interstate Publishers, Inc.
- deBuse, C., 2008. Spring Fertilization for Walnuts. University of California Cooperative Extension Tehama County. Fruit and Nuts Notes, April, 2008, 5.
- Deng, X., Weinbaum, S.A., DeJong, T.M., 1989. Use of labeled nitrogen to monitor transition in nitrogen dependence from storage to current-year uptake in mature walnut trees. Trees 3, 11-16.
- Doll, D., 2010. Tips for maximizing nitrogen use efficiency for almond.
- Goodman, R.C., Oliet, J.A., Pardillo, G., Jacobs, D.F., 2013. Nitrogen fertilization of black walnut (Juglans nigra L.) during plantation establishment. Morphology and production efficiency. Forest Science 59, 453-463.
- Holtz, B., 2010. Fertilizing one-year old trees – Be careful!
- Krueger, B., 2008. Guidelines for care of young walnuts from planting through the first season. University of California Cooperative Extension Tehama County. Fruit and Nuts Notes, April, 2008, 4.
- Niederholzer, F., 2011. Using urea efficiently.
- Niederholzer, F., 2012. Nitrogen use efficiency in almonds. Sacramento Valley Almond News, April 2012.
- Olson, B., Shawareb, N., 1996. Effects of pre-plant fertilizers applied in auger hole on the growth of Chandler cultivar walnuts. The Walnut Marketing Board of California. Walnut Research Reports 1996, 301-304.
- Richardson, W.F., Meyer, R.D., 1990. Spring and summer nitrogen applications to Vina walnuts. California Agriculture 44(4), 30-32.
- Serr, E.F., 1961. Nutritional deficiencies and fertilization practices in California walnut orchards. 52nd Annual Report of the Northern Nut Growers Association. pp 69-74.
- Sibbet, G.S., 1993. Effects of one “in tree hole” fertilizer on first year growth of walnut trees planted in a high fertility soil. The Walnut Marketing Board of California. Walnut Research Reports 1993, 189-195.
- Sibbett, G.S., Coates, W.W., Edstrom, J., 1998. Orchard planning, design, and planting. In: Ramos, D.E. (Ed.) Walnut Production Manual. University of California Division of Agriculture and Natural Resources. Publication 3373. pp. 90-98.
- Weinbaum, S. van Kessel, C., 1998. Quantitative estimates of uptake and internal cycling of 14N-labeled fertilizer in mature walnut trees. Tree Physiology 18, 795-801.
- Weinbaum, S.A., Murooka, T.T., Gatlin, P. B., Kelley, K., 1991. Utilization of fertilizer N by walnut trees. The Walnut Marketing Board of California. Walnut Research Reports 1991, 317-334.
- Zasoski, R.J., 1994. Nitrogen efficiency in drip irrigated almonds. FREP Final Report.
Phosphorus
- Anderson, K.K., Grant, J., Weinbaum, S.A., Pettygrove, S., 2006. Guide to efficient nitrogen fertilizer use in walnut orchards. University of California, Agriculture and Natural Resources. Publication 21623.
- Beutel, J., Uriu, K., Lilleland, O., 1976. Leaf analysis for California deciduous fruits. In: Reisenauer, H.M. (Ed.) Soil and Plant-Tissue Testing in California. University of California Cooperative Extension Bulletin 1879. pp. 15-17.
- Brown, P., 2009. Are critical values for nutrient management in almond and pistachio orchards invalid? Fluid Journal 17(3), Issue #65.
- Brown, P.H., Uriu, K., 1998. Nutritional deficiencies and toxicities in walnut: Diagnosis and correcting imbalances. In: Ramos, D.E. (Ed.) Walnut Production Manual. University of California Division of Agriculture and Natural Resources. Publication 3373. pp. 187-196.
- Buchner, R.P., Fulton, A.E., Gilles, C.K., Prichard, T.L., Lampinen, B.D., Shackel, K.A., Metcalf, S.G., Little, C.C., Schwankl, L.J., 2008. Effects of regulated deficit irrigation on walnut grafted on ‘Northern California Black’ or ‘Paradox’ rootstock. Acta Horticulturae, no. 792.
- Catlin, P.B., 1998. Root physiology and rootstock characteristics. In: Ramos, D.E. (Ed.) Walnut Production Manual. University of California Division of Agriculture and Natural Resources. Publication 3373. pp. 119-126.
- Demirbas, A., 2002. Fuel characteristics of olive husk and walnut, hazelnut, sunflower, and almond shells. Energy Sources, 24, 215-221.
- Fulton, A., 2010. Understanding and applying information from a soil test: Part 2 – NPK.
- Lavedrine, F., Ravel, A., Villet, A., Ducros, V., Alary, J., 2000. Mineral composition of two walnut cultivars originating in France and California. Food Chemistry 68, 347-351.
- Payne, T., 1985. California walnuts and light foods. Cereal Foods World 30, 215-218.
- Randoin, L., Legallic, P., Dupuis, Y., Bernardin, A., 1985. Table de composition des aliments. Institut scientifique d'hygiene alimentaire, Ed Lanore, J., Paris.
- Ravai, M., 1992. Quality characteristics of California walnuts. Cereal Foods World 37, 362-366.
- Reil, W., Sibbett, S., Ramos, D., 1992. Walnut cultivar nutritional evaluation. The Walnut Marketing Board of California. Walnut Research Reports 1992, 271-283.
- Serr, E.F., 1960. Walnut orchards on volcanic soils deficient in phosphorus. California Agriculture 14(6), 6-7.
- Serr, E.F., 1961a. Nutritional deficiencies and fertilization practices in California walnut orchards. 52nd Annual Report of the Northern Nut Growers Association. pp 69-74.
- Serr, E.F., 1961b. Response of Persian walnut to superphosphate. Proceedings of the American Society for Horticultural Science 77, 301-307.
- Sibbett, G.S., Coates, W.W., Edstrom, J., 1998. Orchard planning, design, and planting. In: Ramos, D.E. (Ed.) Walnut Production Manual. University of California Division of Agriculture and Natural Resources. Publication 3373. pp. 90-98.
Potassium
- Anderson, K.K., Grant, J., Weinbaum, S.A., Pettygrove, S., 2006. Guide to efficient nitrogen fertilizer use in walnut orchards. University of California, Agriculture and Natural Resources. Publication 21623.
- Beutel, J., Uriu, K., Lilleland, O., 1976. Leaf analysis for California deciduous fruits. In: Reisenauer, H.M. (Ed.) Soil and Plant-Tissue Testing in California. University of California Cooperative Extension Bulletin 1879. pp. 15-17.
- Brown, P., 2009. Are critical values for nutrient management in almond and pistachio orchards invalid? Fluid Journal 17(3), Issue #65.
- Brown, P.H., Uriu, K., 1998. Nutritional deficiencies and toxicities in walnut: Diagnosis and correcting imbalances. In: Ramos, D.E. (Ed.) Walnut Production Manual. University of California Division of Agriculture and Natural Resources. Publication 3373. pp. 187-196.
- Buchner, R.P., Fulton, A.E., Gilles, C.K., Prichard, T.L., Lampinen, B.D., Shackel, K.A., Metcalf, S.G., Little, C.C., Schwankl, L.J., 2008. Effects of regulated deficit irrigation on walnut grafted on ‘Northern California Black’ or ‘Paradox’ rootstock. Acta Horticulturae, no. 792.
- Covert, M., Connell, J.H., 2010. Potassium deficiency in walnuts. University of California Cooperative Extension Tehama County. Fruit and Nuts Notes, September, 2010, 10-11.
- Catlin, P.B., 1998. Root physiology and rootstock characteristics. In: Ramos, D.E. (Ed.) Walnut Production Manual. University of California Division of Agriculture and Natural Resources. Publication 3373. pp. 119-126.
- Demirbas, A., 2002. Fuel characteristics of olive husk and walnut, hazelnut, sunflower, and almond shells. Energy Sources, 24, 215-221.
- Fulton, A., 2010. Understanding and applying information from a soil test: Part 2 – NPK.
- Grant, J.A., 1992. Comparison of chloride and sulphate salts as fertilizer sources of potassium for walnuts. The Walnut Marketing Board of California. Walnut Research Reports 1992, 284-287.
- Khir, R., Pan, Z., Atungulu, G.G., Thompson, J.F., Shao, D., 2013. Size and moisture distribution characteristics of walnuts and their components. Food and Bioprocess Technology 6, 771-782.
- Lavedrine, F., Ravel, A., Villet, A., Ducros, V., Alary, J., 2000. Mineral composition of two walnut cultivars originating in France and California. Food Chemistry 68, 347-351.
- Olson, B., 1991. The effects of various potassium (K) levels on Chandler walnut trees, yield, and nut quality. The Walnut Marketing Board of California. Walnut Research Reports 1991, 307-312.
- Olson, B., 1995. Comparison of efficiency of potassium application methods to walnuts. The Walnut Marketing Board of California. Walnut Research Reports 1995, 319-334.
- Olson, B., Schulbach, H., Uriu, K., 1985. Potassium chloride injection through sprinklers. The Walnut Marketing Board of California. Walnut Research Reports 1985, 233-234.
- Olson, B., Uriu, K., Pearson, J., 1989. Comparison of efficiency of potassium application methods to walnuts including injection and distribution through sprinklers. The Walnut Marketing Board of California. Walnut Research Reports 1989, 269-271.
- Olson, B., Uriu, K., Pearson, J., 1990. Comparison of efficiency of potassium application methods to walnuts including injection and distribution through sprinklers. The Walnut Marketing Board of California. Walnut Research Reports 1990, 246-249.
- Painter, J.H., Raese, J.T., 1965. Mineral content of walnut (Juglans regia L.) hulls, shells, and kernels. Proceedings of the American Society for Horticultural Science 87, 226-228.
- Payne, T., 1985. California walnuts and light foods. Cereal Foods World 30, 215-218.
- Randoin, L., Legallic, P., Dupuis, Y., Bernardin, A., 1985. Table de composition des aliments. Institut scientifique d'hygiene alimentaire, Ed Lanore, J., Paris.
- Ravai, M., 1992. Quality characteristics of California walnuts. Cereal Foods World 37, 362-366.
- Reil, W., Sibbett, S., Ramos, D., 1992. Walnut cultivar nutritional evaluation. The Walnut Marketing Board of California. Walnut Research Reports 1992, 271-283.
- Serr, E.F., 1961. Nutritional deficiencies and fertilization practices in California walnut orchards. 52nd Annual Report of the Northern Nut Growers Association. pp 69-74.
- Sibbett, G.S., Coates, W.W., Edstrom, J., 1998. Orchard planning, design, and planting. In: Ramos, D.E. (Ed.) Walnut Production Manual. University of California Division of Agriculture and Natural Resources. Publication 3373. pp. 90-98.