Wheat Fertilization Guidelines
Funding provided by:

- Preplant
- Sowing
- Tillering
- Stem
Elongation - Heading
- Ripening
Nitrogen
(N) 
Wheat Nitrogen Nutrition
Deficiency Symptoms
Nitrogen deficient wheat plants are stunted and of pale
green to yellow color. Yellowing begins at the tips and
gradually extends down the leaf. Nitrogen can be
translocated from older to younger leaves. For this
reason, older leaves show symptoms first [N32, N38].
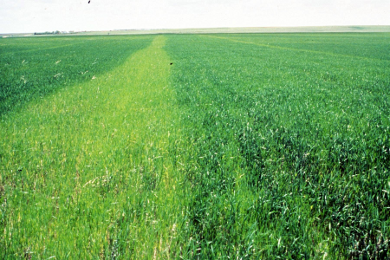 Applicator strip with N
omitted on the left, well fertilized wheat on the right
(photo provided by the International Plant Nutrition Institute).
Applicator strip with N
omitted on the left, well fertilized wheat on the right
(photo provided by the International Plant Nutrition Institute).
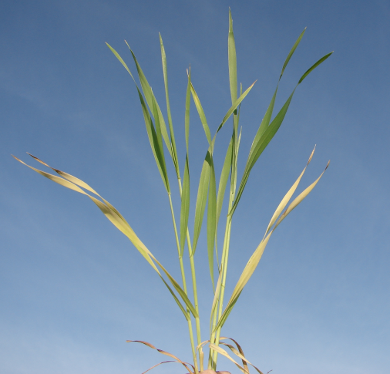 Nitrogen deficient wheat
plant. Deficiency symptoms are most pronounced on older
leaves (photo provided by the International
Plant Nutrition Institute).
Nitrogen deficient wheat
plant. Deficiency symptoms are most pronounced on older
leaves (photo provided by the International
Plant Nutrition Institute).
Excessive Nitrogen
Excess N can result in lodging and delayed maturity. However, other factors, such as variety selection, seeding rate, and use of plant growth regulators also affect the susceptibility of wheat to lodging [N30, N35, N37].
Phosphorus
(P2O5)
Wheat Phosphorus Nutrition
Deficiency Symptoms
Phosphorus deficient plants are dark green and grow
slowly. Under severe P deficiency, leaf tips die back and
the foliage may turn purple to red. Older leaves show
symptoms first because P can be translocated within the
plant. In the soil however, P is immobile. In cold wet
soil, P supply may be reduced due to slow root growth and
decreased P mineralization by microorganisms [P23].
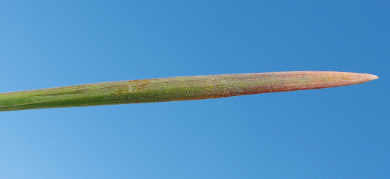 Leaf of a P deficient wheat
plant with dark purple discoloration on the tip, advancing
down the leaf in a broad front (photo provided by the International
Plant Nutrition Institute).
Leaf of a P deficient wheat
plant with dark purple discoloration on the tip, advancing
down the leaf in a broad front (photo provided by the International
Plant Nutrition Institute).
Potassium
(K2O)
Wheat Potassium Nutrition
Deficiency Symptoms
First symptoms of K deficiency include yellow leaves. The
yellowing begins at the leaf tips and extends towards the
leaf base along the edges, while the center of the leaf
remains green at first (see picture). When K deficiency
becomes more severe, leaves may be streaked with yellow or
appear scorched along the margins. Potassium can be
translocated within plants to the most active organs. For
this reason, deficiency symptoms first appear on older
leaves [K12, K15].
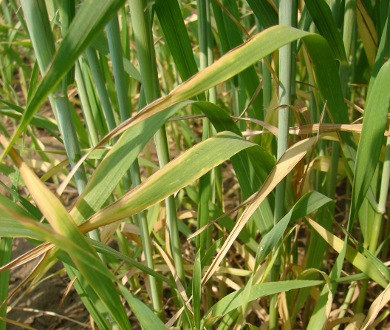 Older wheat leaves with K
deficiency symptoms (photo provided by the International
Plant Nutrition Institute).
Older wheat leaves with K
deficiency symptoms (photo provided by the International
Plant Nutrition Institute).
Soil Test
Soil Nitrate Test
Sampling close to planting or in spring before the first topdress application is recommended to determine residual nitrate-N. The nitrate level depends on a number of factors related to soil properties, weather and crop management (see Factors Affecting Soil Nitrate-N). Therefore, the test needs to be carried out every year. Due to the variability of nitrate in the soil, care must be taken to assure that the sample is representative for the field (see Sampling Instructions).
Soil is generally sampled to a depth of 1 to 2 feet. This
is the part of the profile where root density is highest [N28]. However, roots of
irrigated wheat may reach a depth of 7 feet in the absence
of restricting soil layers [N45].
The first and second foot depth increments are sampled
separately [N28].
Pounds of nitrate-N potentially available per acre in each
foot of soil can be estimated by multiplying parts per
million of nitrate-N by 4 [N28].
For example, a nitrate-N concentration of 10 ppm in the
top foot of the profile corresponds to 40 lbs N/acre.
However, a proportion of the residual nitrate may be
leached below the zone of active root uptake with rainfall
or irrigation water.
Irrigation Water Analysis
When well water is used for irrigation, a considerable amount of N may be applied with the irrigation water. To convert nitrate-N concentration in the water to lbs N/acre, ppm nitrate-N in the water is multiplied by 0.226 and by the number of acre-inches of water applied [N28]. For example, with 1 acre-inch of water containing 10 ppm nitrate-N, 2.26 lbs N are applied per acre.
Plant Analysis
Plant Analysis
The nutrient status of wheat can be determined by analyzing leaves or stems. Stem nitrate-N concentrations were found to vary considerably between sites, while total plant N at tillering was less affected by site-specific factors [N16]. Due to site-specific differences, N fertilization decisions should not be based on plant analyses alone.
Non-uniform fields are best divided into uniform areas which are sampled separately. Atypical areas in a field should be avoided (if small) or sampled separately. For more information on sampling procedure see Plant Tissue Sampling.
Leaf Analysis
For a representative sample, the top four leaves
from 50 to 100 randomly selected plants should be
sampled [N18].
Fresh tissue samples should be placed in open, clean
paper bags. The samples may be partially air-dried
or kept cool during shipment to the laboratory [N18].
Leaf analysis guidelines for wheat [N11].
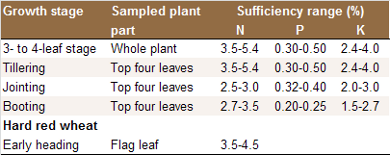
The sufficiency range for hard red wheat is higher
due to protein goals for grain marketability.
Stem Analysis
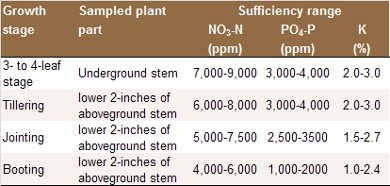
For a representative sample, 20 to 40 stems should
be collected at random from a field. The bottom 1 to
2 inches of each stem are used for analysis and the
roots and plant tops are cut off. The sample should
be sent to the lab the day it has been collected.
For an accurate result, the sample needs to be free
of soil and old leaves [N40].
Stem analysis guidelines for wheat [N11].
Leaf Greenness
The N status of wheat is reflected in the leaf color, with light green leaves indicating low N availability while dark green leaves are typical for N sufficient plants. The leaf greenness of wheat plants can be determined using a hand-held device, such as the SPAD Chlorophyll Meter [N34].
In a study carried out at multiple sites in the San Joaquin Valley, Marsh [N22] found a good correlation between SPAD Chlorophyll Meter readings and the leaf-N concentration at late tillering, early stem elongation stage (Feekes stage 5-6).
Marsh [N22] recommends the following sampling protocol:
- A reference area within the field should be established at least three weeks prior to sampling. The reference area should be in a representative part of the field and can consist of several small areas throughout the field or a strip through the field. The full N fertilizer rate is applied to the reference area.
- SPAD meter measurements should be made mid-leaf on the youngest fully exposed leaf at the late tillering, early stem elongation stage (Feekes stage 5-6). At least 30 readings should be made throughout the field and reference area. Reading should not be taken from atypical plants or areas of the field.
The larger the difference in the Chlorophyll Meter reading between the reference area and the rest of the field, the more N needs to be applied [N22].
Preplant N
Seasonal N Requirements
Nitrogen is best supplied to wheat in split applications for several reasons [N20, N26, N27, N42]. First, preplant N may be leached or denitrified during the winter, which reduces its efficiency [N42]. Second, grain protein content is better managed with topdress applications, as preplant N application rates generally have a small effect on grain protein content. [N20, N42]. Therefore, preplant and early season N should be applied to achieve the yield goal, while a late-season N application is needed to achieve the required grain protein content [N17, N26, N27, N42].
Preliminary results from a 2 year-study in Siskiyou and Fresno County show that yields of 4 to 4.6 tons/acre can be produced with a total N application of 150-200 lbs N/acre [N26, N27, N25, N41]. In these trials, yield was maximized when most of the N was applied at tillering. In addition to fertilizer N, residual nitrate-N in the top foot of the soil profile at planting potentially contributed an additional 30-80 lbs N/acre.
Based on the results of a study carried out in the Imperial Valley with durum wheat, Robinson and coworkers [N30] recommended applying 240 lbs N/acre evenly split into a preplant, tillering and boot stage application. A more recent study carried out in the Imperial Valley found that N rates exceeding 350 lbs/acre did not have a significant effect on yield, which averaged 3.8 to 4.2 tons/acre [N2, N3]. 350 lbs/acre was the lowest rate included in the study.
Studies conducted in the Great Plains and Pacific Northwest found that wheat needs 60 to 100 lbs N to produce 1 ton of grain. This amount of N includes fertilizer N, residual soil N, N mineralized during the growing season, as well as N in the irrigation water [N15]. Therefore, to produce a yield of 4 tons/acre, wheat needs on average 320 lbs/acre of total N from all sources.
Preplant Nitrogen
Application Rate
The optimal preplant N application rate depends on the residual nitrate-N at planting. If the crop is sown in late fall, little N is taken up until late January to early February [N24]. In fact, wheat plant take up only approximately 20-25% of the total N before the stem elongation (jointing) stage is reached [N36]. Therefore, wheat does generally not require more than 40-60 lbs N/acre before spring, which includes residual nitrate-N in the root zone.
The recommended preplant N rates vary widely, likely reflecting the fact that the residual nitrate-N concentration is site-specific and varies from one year to the other. Brittan [N7] recommends applying 0-150 lbs N/acre at planting. Based on the results of a study carried out in the Imperial Valley with durum wheat, Robinson and coworkers [N30] recommended applying 80 lbs N/acre at preplant. In recent studies in Siskiyou County, Orloff [N26, N27] found that applications at tillering were most effective and that high rates of preplant N (up to 150 lbs/acre) did not appear to be effective when sufficient N was available at later growth stages. For more information contact your local farm advisor.
Mode of Application
Preplant N is most often broadcast.
Urea should be incorporated mechanically or with rainfall or irrgiation water to reduce ammonia losses [N15]. Ammonia volatilization losses may also be large with UAN solution when not incorporated.
Research in corn has shown that injecting UAN solution in a band below the surface is more efficient than broadcasting and incorporating it [N21]. However, the band should not be placed directly under the seeds, because the release of ammonia can damage seedlings (see Starter N) [N13].
Anhydrous ammonium and aqua ammonia must be injected 6 to 8 inches deep in loamy soils and 8-10 inches deep in sandy soils to avoid losses of gaseous ammonia [N4, N33].
Fertilizer Type
Common N fertilizers are urea, UAN (sometimes referred to as UN32), ammonium sulfate, and anhydrous ammonia [N15]. When losses are minimized (see Mode of Application), the different N sources are equally effective.
Time of Application
Preplant N is generally applied close to planting to reduce the time between application and plant uptake by the when plants.
Starter N
Starter Nitrogen
Starter fertilizer, which generally contains N and P, promotes early growth.
Application Rate
The amount of starter fertilizer that can be applied safely is limited because high ammonium concretions may injure the seedlings. Munier and coauthors [N24] recommend limiting the amount of N applied as a starter fertilizer near the seed to no more than 25-30 lbs/acre, while Brittan [N8] recommended applying no more than 100 lbs/acre of a 16-20-0 blend, which equates to 16 lbs N/acre. In dry soil, the application rate should be reduced even more [N8]. Before stem elongation (jointing stage) takes place, wheat plants take up only approximately 20-25% of the total N, corresponding to 40-60 lbs/acre [N36]. When the total N requirements until spring are not met by the starter fertilizer and the residual soil nitrate, the rest needs to be applied preplant [N1].
Fertilizer Type
Nitrogen can enhance the uptake of phosphorus when both nutrients are band-applied [N19, N31].
To prevent seedling injury, blends with a low N content of about 10% and a high P2O5 content ranging from 30 to 50% are often used [N24]. Monoammonium phosphate is preferred over diammonium phosphate or blends containing urea, because the latter two may release ammonia, which can damage seedling roots [N23, N24].
Topdress N
Topdress Nitrogen
Application Rate
The amount of early season N that needs to be applied is the difference between the total N application rate and the N applied preplant, as starter and later in the season at flowering. Recent studies found that 4 to 4.6 tons /acre can be produced with a total N application of 150-200 lbs N/acre in fields where the residual soil nitrate N in the top foot of the profile ranged from 30-80 lbs N/acre at planting [N26, N27, N25, N41]. When well water is used for irrigation, the N in the water needs also be taken into account [N28]. 2.26 lbs N/acre are applied with 1 acre-inch of irrigation water with a nitrate-N concentration of 10 ppm.
A small application of 30-60 lbs/acre applied at flowering has been found most effective in increasing grain protein content [N9, N17, N26, N27].
Mode of Application
When N fertilizer is broadcast, it needs to be applied before an irrigation to move the N into the soil [N37, N42]. Irrigating the field is especially important when urea or UAN are applied, because the hydrolysis of urea by urease increases soil pH, which can result in high ammonia volatilization losses when the material is left on the surface [N6].
Fertilizer Type
Ammonium sulfate, UAN and urea can be used for topdress applications[N9, N10, N37]. UAN contains nitrate, which is very mobile in the soil and moves to the roots when plants take up water.
Anhydrous ammonia, UAN, and aqua ammonia are the primary fertilizers used for water run applications. The nitrate component in UAN is readily available to the crop [N40]. However, the spatial distribution of the N along the length of the field may be poor, especially in sandy soil. This reduces overall N use efficiency, as parts of the field may receive too much N and other parts too little.
Time of Application
The rate of N uptake is highest between the beginning of stem elongation and early heading. During this period, approximately 60% of the total N is taken up [N36]. Therefore, early season N should be applied at tillering so that the N is available when demand by the wheat plants increases at stem elongation. Recent studies have shown that yield may be maximized when most of the N is applied at tillering just ahead of the period of peak uptake [N26, N27].
When grain protein content is relevant, some N should be supplied late in the season. Nitrogen acquired after flowering (anthesis) was found to be almost entirely translocated to the grains [N42, N43, N44]. The N uptake capacity of wheat remains reasonably constant during the three weeks following flowering unless soil drying is severe [N44].
Foliar N
Foliar Nitrogen
The yield response of wheat to foliar N differs between studies [N14, N29, N39]. When N availability is limited, foliar N applications before flag leaf emergence may increase grain yield [N14].
Foliar N applications at flowering (anthesis) or during the following two weeks may increase grain protein content [N5, N12, N14]. Woolfolk and coworkers [N39] found that an application of 30 lbs N/acre as UAN was most beneficial for grain protein content. However, in a study carried out at various locations in the Sacramento and San Joaquin Valley, Jackson [N17] found that the application of 30 lbs N/acre as foliar urea was less effective than soil-applied ammonium nitrate at the same rate.
Foliar application of N may damage the leaves, resulting in a discoloration of leaf tips. The risk of leaf damage appears to be lower with urea than with ammonium nitrate and ammonium sulfate [N14]. The risk is increased with applications early in the morning when dew is still on the crop and the leaves remain wet for an extended period. In contrast, rapid drying of solutions on the leaves in dry weather may reduce the risk of leaf damage [N14].
Aerial applications of UAN or foliar urea with MCPA or dicamba are possible. Application rates should not exceed 25 lbs N/acre. Considerable leaf burn and some degree of yield loss is likely when foliar UAN is applied when air temperatures exceed 80 °F [N40]. For more information contact your local farm advisor.
Soil Test
Soil Analysis
Soil Sampling
Soil samples are generally taken in fall or spring from the top foot of the profile [P18]. See Soil Test Sampling for sampling instructions.
The root density of wheat is highest in the top foot of the profile; however, roots of irrigated wheat may potentially reach a depth of 7 feet in the absence of restricting soil layers [P25]. Therefore, wheat plants can also access nutrients below the soil layer tested, which is one reason why soil test values do not always match the nutrient availability of a site. To make accurate P fertilization decisions, soil test values are best combined with tissue P concentrations and P budgets (see Preplant Application Rate).
In California, the available soil P is generally determined on sodium bicarbonate extracts (Olsen-P test). This test should be limited to soils with a pH between 5.5 and 8.5 containing less than 3% of organic matter. For soil outside this range, water or calcium chloride extracts may be more reliable [P18]. For more information contact your local farm advisor.
Interpretation of Test Results
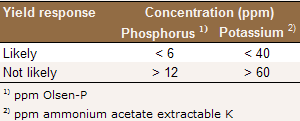
Wheat grown in soils with Olsen-P values greater than 12 ppm is unlikely to respond to P applications (see Table) [P18]. Based on research conducted in the Sacramento Valley, Brittan [P4] recommended using a threshold of 15.2 ppm. These recommendations are in line with a recent study carried out in the Imperial Valley, where P fertilization had no effect on yield, in a field with an average Olsen P value of 17.5 ppm [P1]. However, a small starter P application may be beneficial, especially when the soil is cool (see Starter P).
When the Olsen P test is between 6 and 15 ppm, wheat may respond to P fertilization, while a response is likely when the soil test level is below 6 ppm (see Table) [P4, P18].
Wheat grown directly after rice is often P
deficient, even though the soil test suggests
adequate P is availability. In this case, the Olson
P test is not a reliable measure of P availability [P3].
Interpretation of P and K soil test levels in the
top foot of the soil profile [P18].
Plant Analysis
Plant Analysis
The nutrient status of wheat can be determined by analyzing leaves or stems. Site-specific factors may affect plant nutrient concentrations. For this reason, fertilization decisions should not be based on plant analyses alone.
Non-uniform fields are best divided into uniform areas which are sampled separately. Atypical areas in a field should be avoided (if small) or sampled separately. For more information on sampling procedure see Plant Tissue Sampling.
Leaf Analysis
For a representative sample, the top four leaves
from 50 to 100 randomly selected plants should be
sampled [P10].
Fresh tissue samples should be placed in open, clean
paper bags. The samples may be partially air-dried
or kept cool during shipment to the laboratory [P10].
Leaf analysis guidelines for wheat [P6].
The sufficiency range for hard red wheat is higher
due to protein goals for grain marketability.
Stem Analysis
For a representative sample, 20 to 40 stems should
be collected at random from a field. The bottom 1 to
2 inches of each stem are used for analysis and the
roots and plant tops are cut off. The sample should
be sent to the lab the day it has been collected.
For an accurate result, the sample needs to be free
of soil and old leaves [P24].
Stem analysis guidelines for wheat [P6].
Preplant / Starter P
Preplant / Starter Phosphorus
Applying starter fertilizer near the seeds is an efficient way of providing P to the young plants. Starter fertilizer can increase overall early dry-matter production, but doesn’t always result in higher yield [P5]. Broadcast P applications tend to be less effective than starter band applications, especially at low soil temperatures and low P availability [P3, P4, P12, P17, P20].
Starter fertilizers generally also contain N because the presence of ammonium can enhance the uptake of P [P11, P19]. For example, Brandon and Mikkelsen [P3] found that monoammonium phosphate applied in a band one inch below the seed corrected P deficiency of wheat and barley following rice more efficiently than triple super phosphate. High ammonium concentrations, however, may damage seedling roots, limiting the amount of material that can be safely applied near the seeds.
Application Rate
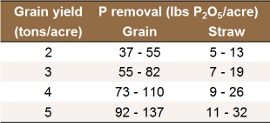
The optimal P application rate depends on the soil test analysis and the yield potential. To maintain optimal soil P availability in the long term, the amount of P removed at harvest should be replaced with fertilizer P (see Table). However, the economically optimal P application rate may be lower. Contact your local farm advisor for more information.
Higher rates may be required in soils with a very low P availability, in soils that fix P, and when wheat is grown after flooded rice. Brandon and Mikkelsen [P3] found that grain yield of wheat grown after flooded rice could be significantly increased with 50-80 lbs P/acre (120-180 lbs P2O5/acre).
When Olsen P values are high (above 12-15 ppm), a
yield response is unlikely. Wheat seedlings may
benefit from a small starter application, but this
may not translate into a higher yield [P5].
Approximate amount of P removed with grain and
straw.
The amount of starter fertilizer that can be applied safely depends on its N to P ratio. Munier and coauthors [P16] recommend limiting the amount of N added to 25-30 lbs/acre, while Brittan [P4] recommended applying no more than 100 lbs/acre of a 16-20-0 blend, which corresponds to an N application rate of 16 lbs/acre. In dry soil, the application rate should be reduced even more [P4].
Calculation of the P removal rate
Mode of Application
Preplant broadcast applications should be incorporated because P is immobile in the soil and the surface layer is more likely to dry out restricting root access [P8]. Incorporation may also reduce P losses due to surface runoff [P21] and reduce weed pressure, which may be increased by broadcast P [P2].
Starter fertilizers are generally banded two inches to the side and two inches below the seed row [P14]. Brittan [P4] mentioned that fertilizer can be applied at or up to 1 inch below seed level, but not above the seed level.
Fertilizer Type
A number of granular and liquid P fertilizers are available for preplant applications. Fact sheets of the most common fertilizers can be found on the web site of the International Plant Nutrition Institute.
For starter applications, blends with a low N content of about 10% and a high P2O5 content ranging from 30 to 50% are often used [P16]. Monoammonium phosphate is preferred over diammonium phosphate or blends containing urea, because the risk of seedling root damage is increased with the latter two [P14, P16].
Time of Application
When smaller application rates are required, all P may be applied as a starter. When larger quantities are needed, it may be more practical to apply a small amount as a starter and broadcast the rest preplant.
Preplant P fertilizer is best applied before a tillage operation when broadcast. However, the time of application is not as crucial as it is with N because P is immobile in the soil and does not leach.
Topdress P
Topdress Phosphorus
Early season P supply is critical for optimum crop yield, because early P limitation has a much larger impact on yield than do P limitations later in the season [P8]. For this reason, P is generally applied preplant or at seeding.
Foliar P
Foliar Phosphorus
With adequate P availability, foliar P applications have generally limited effect on yield. When the plants are P deficient due to inadequate early season applications or when the plants suffer water stress, wheat grain yield may be improved with foliar P applications [P9, P15].
Application rates of 1.5-3.6 lbs P/acre (3.5-8.2 lbs P2O5/acre) have been found most effective [P13, P15]. This application rate is low compared to the P taken up by wheat, indicating that foliar P may supplement soil applied P, but cannot substitute it.
Mosali and coworkers [P15] reported that foliar P applications during stem elongation (Feekes stage 7) were generally more efficient than applications at heading or after flowering (Feekes stages 10.1 or 10.54).
Studies that found a positive yield response used phosphoric acid or potassium dihydrogen phosphate (KH2PO4) [P13, P15].
Soil Test
Soil Analysis
Soil Sampling
Soil samples are generally taken in fall or spring from the top foot of the profile [K11]. See Soil Test Sampling for sampling instructions.
The root density of wheat is highest in the top foot of the profile; however, roots of irrigated wheat may potentially reach a depth of 7 feet in the absence of restricting soil layers [K17]. Therefore, wheat plants can also access nutrients below the soil layer tested, which is one reason why soil test values do not always match the nutrient availability of a site. To make accurate K fertilization decisions, soil test values are best combined with tissue K concentrations and K budgets.
Plant available K is determined by extracting the soil samples with an ammonium acetate solution [K11].
Interpretation of Test Results
Wheat grown in soils with soil test K values
greater than 60 ppm is unlikely to respond to K
applications, while a response is likely with soil
test K values below 40 ppm (see Table) [K11]. For soil
test based K application rates see Preplant K.
Interpretation of P and K soil test levels in the
top foot of the soil profile [K11].
Plant analysis
Plant Analysis
The nutrient status of wheat can be determined by analyzing leaves or stems. Site-specific factors may affect plant nutrient concentrations. For this reason, fertilization decisions should not be based on plant analyses alone.
Non-uniform fields are best divided into uniform areas which are sampled separately. Atypical areas in a field should be avoided (if small) or sampled separately. For more information on sampling procedure see Plant Tissue Sampling.
Leaf Analysis
For a representative sample, the top four leaves
from 50 to 100 randomly selected plants should be
sampled [K7].
Fresh tissue samples should be placed in open, clean
paper bags. The samples may be partially air-dried
or kept cool during shipment to the laboratory [K7].
Leaf analysis guidelines for wheat [K2].
The sufficiency range for hard red wheat is higher
due to protein goals for grain marketability.
Stem Analysis
For a representative sample, 20 to 40 stems should
be collected at random from a field. The bottom 1 to
2 inches of each stem are used for analysis and the
roots and plant tops are cut off. The sample should
be sent to the lab the day it has been collected.
For an accurate result, the sample needs to be free
of soil and old leaves [K16].
Stem analysis guidelines for wheat [K2].
Preplant K
Preplant Potassium
A yield response to K fertilization is unusual in California and generally only occurs in soils with a soil K test level of less than 60 ppm [K11].
Application Rate
To maintain optimal K availability in the long
term, the amount of K removed at harvest should be
replaced with fertilizer K (see Table) Higher
application rates may be required when soil or
tissue tests suggest sub-optimal K availability and
on soils that fix K. Contact your local farm advisor for more
information.
Approximate amount of K removed with grain and
straw.
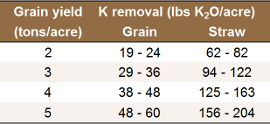
The values in the table were calculated with the following data: The K concentration in grain averages 0.4-0.5% [K3, K13], while it averages 1.5% in straw [K3, K13]. The K removal rates with straw are based on the assumption that approximately one ton of straw is produced per ton of grain.
Mode and Time of Application
Potassium is most often broadcast prior to planting [K6]. Incorporating the fertilizer after application can increase root access, as root growth near the surface is restricted when the surface soil dries out.
With low fertilization rates, nutrient uptake by crops is generally greater for band than for broadcast applications. With higher application rates, the difference between the two methods diminishes [K10].
Fertilizer Type
Potassium chloride (KCl), potassium sulfate (K2SO4), and potassium magnesium sulfate (K2SO4, 2MgSO4) are common K fertilizers. They all contain readily available K. Wheat is relatively salt tolerant [K5], therefore, the choice may be made based on price and whether the application of chloride, sulfate or magnesium is beneficial.
Fact sheets of the most common fertilizers can be found on the web site of the International Plant Nutrition Institute.
Starter K
Starter Potassium
Potassium is generally not included in starter fertilizer. If a starter blend containing K is used, it needs to be applied with care, as K and ammonium may damage seedling roots.
With blends containing N and P only, the total amount of N that can be applied safely should not exceed 15-30 lbs/acre [K1, K9]. When starter fertilizer contains K and N, the sum of N and K2O should not exceed this rate. In addition, the fertilizer band needs to be applied at a distance of at least two inches to the side and two inches below the seed row [K8].
Topdress K
Topdress Potassium
Potassium is generally applied preplant. Little research has been done to study the effect of sidedress K on wheat.
In very sandy soils with a low soil organic matter content, K may be leached. In these soils it may be beneficial to apply some K preplant and the rest during the growing season [K6]. As most K, approximately 80% of the total requirement, is taken up between the beginning of stem elongation (jointing) and heading [K14], in-season K should be applied at tillering so that it is available when the plants need it.
Foliar K
Foliar Potassium
Little research has been done investigating the effects of foliar K applications to wheat. Potassium is required in much larger amounts than what can be applied with foliar fertilizers [K4]. Therefore, foliar K applications can at best supplement soil applied K, but not replace it.
Acknowledgments
Guidelines and Webpage Design:
- Daniel Geisseler, Ph.D.; Post Doctoral Scientist; Department of Land, Air and Water Resources, University of California, Davis
Reviewers:
- Steve Orloff; Farm Advisor; University of California Cooperative Extension Siskiyou County
- William R. Horwath, Ph.D.; Professor of Soil Biogeochemistry and James G. Boswell Endowed Chair in Soil Science; Department of Land, Air and Water Resources, University of California, Davis
Support:
- Asif Maan, Ph.D.; Branch Chief Feed,
Fertilizer, and Livestock Drugs Regulatory Services,
California Department of Food and Agriculture
- Amrith Gunasekara, Ph.D.; Science Advisor to the Secretary; California Department of Food and Agriculture
- Erika Lewis; Fertilizer Research and Education Program, California Department of Food and Agriculture
Last Update: December, 2013
Additional Information:
Links:
- University of California - Agronomy Research and Information Center
- University of California - Agriculture and Natural Resources: Small Grain Production Manual
- University of California IPM Online
- California Wheat Commission
References:
TOP OF PAGE
Nitrogen
- Aksland, G., 2012. Milling wheat fertility management. Proceedings of the 42nd California Alfalfa Forage Symposium, 2012.
- Bali, K., 2011. Wheat fertilization practices in the Imperial Valley. 2010-11 California Wheat Commission Research Report.
- Bali, K., 2012. Wheat fertilization practices in the Imperial Valley. 2011-12 California Wheat Commission Research Report.
- Blue, W.G., Eno, C.F., 1954. Distribution and retention of anhydrous ammonia in sandy soils. Soil Science Society of America Proceedings 18, 420-424.
- Bly, A.G., Woodard, H.J., 2003. Foliar nitrogen application timing influence on grain yield and protein concentration of hard red winter and spring wheat. Agronomy Journal 95, 335–338.
- Bouwmeester, R.J.B., Vlek, P.L.G., Stumpe, J.M., 1985. Effect of environmental factors on ammonia volatilization from a urea fertilized soil. Soil Science Society of America Journal 49, 376–381.
- Brittan, K.L., 2001. 2001 Yolo / Solano / Sacramento wheat and barley production.
- Brittan, K.L., 2003. 2003 Yolo / Solano / Sacramento wheat and barley production.
- Brittan, K.L., 2012. 2011-12 Southern Sacramento Valley small grains research program. Hard red wheat protein enhancement by midseason urea application.
- Brown, B.D., Petrie, S., 2006. Irrigated hard winter wheat response to fall, spring, and late season applied nitrogen. Field Crops Research 96, 260–268.
- California Plant Health Association, 2002. Western Fertilizer Handbook 9th edition. Interstate Publishers, Inc.
- Fageria, N.K., Barbosa Filho, M.P., Moreira, A., Guimarães, C.M., 2009. Foliar fertilization of crop plants. Journal of Plant Nutrition 32, 1044-1064.
- Fernández, F.G., Nafziger, E.D., Ebelhar, S.A., Hoeft, R.G., 2012. Managing nitrogen. University of Illinois Extension & Outreach. Illinois Agronomy Handbook.
- Gooding, M.J., Davies, W.P., 1992. Foliar urea fertilization of cereals: A review. Fertilizer Research 32, 209-222.
- Halvorson, AD., Alley, M.M., Murphy, L.S., 1987. Nutrient requirements and fertilizer use. In: Heyne, E.G. (Ed.). Wheat and Wheat Improvement. Agronomy Monographs 13. American Society of Agronomy, Crop Science Society of America, Soil Science Society of America. Madison, WI. pp. 345-383.
- Hawe, W.P., Cassman, K.G., Fulton, A., Jackson, L.F., 1989. Evaluation of tissue nitrogen tests as a prognostic tool for irrigated wheat production. Journal of Fertilizer Issues 6, 89-99.
- Jackson, L.F., 2001. Nitrogen fertilization and grain protein content in California wheat. FREP Final Report.
- Jones Jr., J.B., 1998. Field sampling procedures for conducting a plant analysis. In: Kalra, Y.P. (Ed.). Handbook of Reference Methods for Plant Analysis. CRC Press, Boca Raton. pp. 25-35.
- Leikam, D.F., Murphy, L.S., Kissel, D.E., Whitney, D.A., Moser, H.C., 1983. Effect of N and P application method and N sources on winter wheat grain yield and leaf tissue P. Soil Science Society of America Journal 47, 530-535.
- Linquist, B.A., Cassman, K.G., Fulton, A.E., Jackson, L.F., 1992. Late-season nitrogen may be efficient way to increase winter wheat protein. California Agriculture 46(2), 13-16.
- Maddux, L.D., Raczkowski, C.W., Kissel, D.E., Barnes, P.L., 1991. Broadcast and subsurface-banded urea nitrogen in urea ammonium nitrate applied to corn. Soil Science Society of America Journal 55, 264-267.
- Marsh, B., 2012. Use of chlorophyll meters to assess nitrogen fertilization requirements for optimum wheat grain and silage yield and quality. California Wheat Commission Research Report.
- Mortvedt, J.J., 1976. Band fertilizer placement – How much and how close? Fertilizer Solutions 20, 90-96.
- Munier, D., Kearney, T., Pettygrove, G.S., Brittan, K., Mathews, M., Jackson, L., 2006. Fertilization of small grains. In: UC ANR (Ed.). Small Grain Production Manual. ANR Publication 8208.
- Orloff, S., Wright, S., 2011. Effect of nitrogen fertilization practices on spring wheat protein content. 2010-11 California Wheat Commission Research Report.
- Orloff, S., 2012. Effect of nitrogen fertilization practices on spring wheat yield and protein content. 2011-12 California Wheat Commission Research Report.
- Orloff, S., 2013. Effect of nitrogen fertilization practices on spring wheat yield and protein content. 2012-13 California Wheat Commission Research Report.
- Orloff, S., Wright, S., Ottman, M., 2012. Nitrogen management impacts on wheat yield and protein. Proceedings of the 42nd California Alfalfa Forage Symposium, 2012.
- Phillips, S.B., Mullins, G.L., 2004. Foliar burn and wheat grain yield responses following topdress-applied nitrogen and sulfur fertilizers. Journal of Plant Nutrition 27, 921-930.
- Robinson, F.E., Cudney, D.W., Lehman, W.F., 1979. Nitrate fertilizer timing, irrigation, protein, and yellow berry in durum wheat. Agronomy Journal 71, 304-308.
- Sangakkara, U.R., Cho, C.M., 1987. Effect of NH4+ nitrogen on phosphorus uptake by canola, lentils, soybeans and wheat. Journal of Agronomy and Crop Science 159, 199-201.
- Snowball, K., Robson A.D., 1991. Nutrient Deficiencies and Toxicities in Wheat - A Guide for Field Identification . CIMMYT, Mexico, D.F.
- Stanley, F.A., Smith, G.E., 1956. Effect of soil moisture and depth of application on retention of anhydrous ammonia. Soil Science Society of America Proceedings 20, 557-561.
- Tremblay, N., Fallon, E., Ziadi, N., 2011. Sensing of crop nitrogen status: Opportunities, tools, limitations, and supporting information requirements. HortTechnology 21, 274-281.
- van den Berg, E., Labuschagne, M.T., 2012. The interaction of stem strength with plant density and nitrogen application in wheat progeny from parents with varying stem strength. Acta Agriculturae Scandinavica, Section B - Soil & Plant Science 62, 251-255.
- Waldren, R.P., Flowerday, A.D., 1979. Growth stages and distribution of dry matter, N, P, and K in winter wheat. Agronomy Journal 71, 391-397.
- Webster, J.R., Jackson, L.F., 1993. Management practices to reduce lodging and maximize grain yield and protein content of fall-sown irrigated hard red spring wheat. Field Crops Research 33, 249-259.
- Wiese, M.V., 1993. Wheat and other small grains. In: Bennett, W.F. (Ed.). Nutrient Deficiencies and Toxicities in Crop Plants. APS Press, St. Paul, MN. pp. 27-33.
- Woolfolk, C.W., Raun, W.R., Johnson, G.V., Thomason, W.E., Mullen, R.W., Wynn, K.J., Freeman, K.W., 2002. Influence of late-season foliar nitrogen applications on yield and grain nitrogen in winter wheat. Agronomy Journal 94, 429-434.
- Wright, S., Fulton, A., Munier, D., Jackson, L., 2008. Mid season nitrogen fertility management in wheat and barley. University of California Cooperative Extension Kings County. Small Grain News 5(1), 1-2.
- Wright, S., 2013. Effect of nitrogen fertilization practices on wheat protein content in the San Joaquin Valley. 2012-13 California Wheat Commission Research Report.
- Wuest, S.B., Cassman, K.G., 1992a. Fertilizer-nitrogen use efficiency of irrigated wheat: I. Uptake efficiency of preplant versus late-season application. Agronomy Journal 84, 682-688.
- Wuest, S.B., Cassman, K.G., 1992b. Fertilizer-nitrogen use efficiency of irrigated wheat: II. Partitioning efficiency of preplant versus late-season application. Agronomy Journal 84, 689-694.
- Wuest, S.B., Cassman, K.G., 1992c. Effects of variations in soil water potential, depth of N placement, and cultivar on postanthesis N uptake by wheat. Plant & Soil 143, 45-53.
- Xue, Q., Zhu, Z., Musick, J.T., Stewart, B.A., Dusek, D.A., 2003. Root growth and water uptake in winter wheat under deficit irrigation. Plant & Soil 257, 151–161.
TOP OF PAGE
Phosphorus
- Bali, K., 2011. Wheat fertilization practices in the Imperial Valley. 2010-11 California Wheat Commission Research Report.
- Blackshaw, R.E., Molnar, L.J., 2009. Phosphorus fertilizer application method affects weed growth and competition with wheat. Weed Science 57, 311-318.
- Brandon, D.M., Mikkelsen, D.S., 1979. Phosphorus transformations in alternately flooded california soils: I. Cause of plant phosphorus deficiency in rice rotation crops and correctional methods. Soil Science of America Journal 43, 989-994.
- Brittan, K.L., 2003. 2003 Yolo / Solano / Sacramento wheat and barley production.
- Cabrera, M.L., Kissel, D.E., Whitney, D.A., 1986. Combinations of preplant-banded and seed-banded applications of nitrogen and phosphorus fertilizer for winter wheat production. Agronomy Journal 78, 620-625.
- California Plant Health Association, 2002. Western Fertilizer Handbook 9th edition. Interstate Publishers, Inc.
- Chuan, L., He, P., Jin, J., Li, S., Grant, C., Xu, X., Qiu, S., Zhao, S., Zhou, W., 2013. Estimating nutrient uptake requirements for wheat in China. Field Crops Research 146, 96–104.
- Grant, C.A., Flaten, D.N., Tomasiewicz, D.J., Sheppard, S.C., 2001. The importance of early season phosphorus nutrition. Canadian Journal of Plant Science 81, 211–224.
- Green, D.R., Racz, G.J., 1999. The effect of foliar phosphate solution application on wheat yield and quality. Proceedings of the 42nd Annual Manitoba Soil Science Society Meeting, 90–96.
- Jones Jr., J.B., 1998. Field sampling procedures for conducting a plant analysis. In: Kalra, Y.P. (Ed.). Handbook of Reference Methods for Plant Analysis. CRC Press, Boca Raton. pp. 25-35.
- Leikam, D.F., Murphy, L.S., Kissel, D.E., Whitney, D.A., Moser, H.C., 1983. Effect of N and P application method and N sources on winter wheat grain yield and leaf tissue P. Soil Science Society of America Journal 47, 530-535.
- Matar, A.E., Brown, S.C., 1989. Effect of rate and method of phosphate placement on productivity of durum wheat in Mediterranean environments I. Crop yields and P uptake. Fertilizer Research 20, 75-82.
- McBeath, T.M., McLaughlin, M.J., Noack SR., 2011. Wheat grain yield response to and translocation of foliar-applied phosphorus. Crop & Pasture Science 62, 58–65.
- Mortvedt, J.J., 1976. Band fertilizer placement – How much and how close? Fertilizer Solutions 20, 90-96.
- Mosali, J., Desta, K., Teal, R.K., Freeman, K.W., Martin, K.L., Lawles, J.W., Raun, W.R., 2006. Effect of foliar application of phosphorus on winter wheat grain yield, phosphorus uptake, and use efficiency. Journal of Plant Nutrition 29, 2147-2163.
- Munier, D., Kearney, T., Pettygrove, G.S., Brittan, K., Mathews, M., Jackson, L., 2006. Fertilization of small grains. In: UC ANR (Ed.). Small Grain Production Manual. ANR Publication 8208.
- Randall, G.W., Hoeft, R.G., 1988. Placement methods for improved efficiency of P and K fertilizers: A review. Journal of Production Agriculture 1, 70-78.
- Reisenauer, H.M., Quick, J., Voss, R.E., 1976. Soil test interpretive guides. In: Reisenauer, H.M. (Ed.). Soil and Plant-Tissue Testing in California. University of California Cooperative Extension Bulletin 1879. pp. 38-40.
- Sangakkara, U.R., Cho, C.M., 1987. Effect of NH4+ nitrogen on phosphorus uptake by canola, lentils, soybeans and wheat. Journal of Agronomy and Crop Science 159, 199-201.
- Sheppard, S.C., Racz, C.J., 1985. Shoot and root response of wheat to band and broadcast phosphorus at varying soil temperatures. Canadian Journal of Soil Science 65, 79-88.
- Tarkalson, D.D., Mikkelsen, R.L., 2004. Runoff phosphorus losses as related to phosphorus source, application method, and application rate on a Piedmont soil. Journal of Environmental Quality 33, 1424–1430.
- van Duivenbooden, N., de Wit, C.T., van Keulen, H., 1996. Nitrogen, phosphorus and potassium relations in five major cereals reviewed in respect to fertilizer recommendations using simulation modeling. Fertilizer Research 44, 37-49.
- Wiese, M.V., 1993. Wheat and other small grains. In: Bennett, W.F. (Ed.). Nutrient Deficiencies and Toxicities in Crop Plants. APS Press, St. Paul, MN. pp. 27-33.
- Wright, S., Fulton, A., Munier, D., Jackson, L., 2008. Mid season nitrogen fertility management in wheat and barley. University of California Cooperative Extension Kings County. Small Grain News 5(1), 1-2.
- Xue, Q., Zhu, Z., Musick, J.T., Stewart, B.A., Dusek, D.A., 2003. Root growth and water uptake in winter wheat under deficit irrigation. Plant & Soil 257, 151–161.
Potassium
- Brittan, K.L., 2003. 2003 Yolo / Solano / Sacramento wheat and barley production.
- California Plant Health Association, 2002. Western Fertilizer Handbook 9th edition. Interstate Publishers, Inc.
- Chuan, L., He, P., Jin, J., Li, S., Grant, C., Xu, X., Qiu, S., Zhao, S., Zhou, W., 2013. Estimating nutrient uptake requirements for wheat in China. Field Crops Research 146, 96–104.
- Fageria, N.K., Barbosa Filho, M.P., Moreira, A., Guimarães, C.M., 2009. Foliar fertilization of crop plants. Journal of Plant Nutrition 32, 1044-1064.
- Francois, L.E., Maas, E.V., Donovan, T.J., Youngs, V.L., 1986. Effect of salinity on grain yield and quality, vegetative growth, and germination of semi-dwarf and durum wheat. Agronomy Journal 78, 1053-1058.
- Halvorson, AD., Alley, M.M., Murphy, L.S., 1987. Nutrient requirements and fertilizer use. In: Heyne, E.G. (Ed.). Wheat and Wheat Improvement. Agronomy Monographs 13. American Society of Agronomy, Crop Science Society of America, Soil Science Society of America. Madison, WI. pp. 345-383.
- Jones Jr., J.B., 1998. Field sampling procedures for conducting a plant analysis. In: Kalra, Y.P. (Ed.). Handbook of Reference Methods for Plant Analysis. CRC Press, Boca Raton. pp. 25-35.
- Mortvedt, J.J., 1976. Band fertilizer placement – How much and how close? Fertilizer Solutions 20, 90-96.
- Munier, D., Kearney, T., Pettygrove, G.S., Brittan, K., Mathews, M., Jackson, L., 2006. Fertilization of small grains. In: UC ANR (Ed.). Small Grain Production Manual. ANR Publication 8208.
- Randall, G.W., Hoeft, R.G., 1988. Placement methods for improved efficiency of P and K fertilizers: A review. Journal of Production Agriculture 1, 70-78.
- Reisenauer, H.M., Quick, J., Voss, R.E., 1976. Soil test interpretive guides. In: Reisenauer, H.M. (Ed.). Soil and Plant-Tissue Testing in California. University of California Cooperative Extension Bulletin 1879. pp. 38-40.
- Snowball, K., Robson A.D., 1991. Nutrient Deficiencies and Toxicities in Wheat - A Guide for Field Identification . CIMMYT, Mexico, D.F.
- van Duivenbooden, N., de Wit, C.T., van Keulen, H., 1996. Nitrogen, phosphorus and potassium relations in five major cereals reviewed in respect to fertilizer recommendations using simulation modeling. Fertilizer Research 44, 37-49.
- Waldren, R.P., Flowerday, A.D., 1979. Growth stages and distribution of dry matter, N, P, and K in winter wheat. Agronomy Journal 71, 391-397.
- Wiese, M.V., 1993. Wheat and other small grains. In: Bennett, W.F. (Ed.). Nutrient Deficiencies and Toxicities in Crop Plants. APS Press, St. Paul, MN. pp. 27-33.
- Wright, S., Fulton, A., Munier, D., Jackson, L., 2008. Mid season nitrogen fertility management in wheat and barley. University of California Cooperative Extension Kings County. Small Grain News 5(1), 1-2.
- Xue, Q., Zhu, Z., Musick, J.T., Stewart, B.A., Dusek, D.A., 2003. Root growth and water uptake in winter wheat under deficit irrigation. Plant & Soil 257, 151–161.